Pipeline Template Tutorial
In this tutorial we will build a data ingestion pipeline to ingest some global marine data hosted by the National Oceanic and Atmospheric Administration’s (NOAA) National Centers for Environmental Information (NCEI). The data can be found at https://www.ncdc.noaa.gov/cdo-web/datasets under the “Global Marine Data” section. This is a pretty simple and high-quality dataset, so this data ingest will be pretty straight-forward. We will walk through the following steps in this tutorial:
Examine and download the data
Set up a GitHub repository in which to build our ingestion pipeline
Modify configuration files and ingestion pipeline for our NCEI dataset
Run the ingest data pipeline on NCEI data
Now that we’ve outlined the goals of this tutorial and the steps that we will need to take to ingest this data we can get started with step #1.
Examining and downloading the data
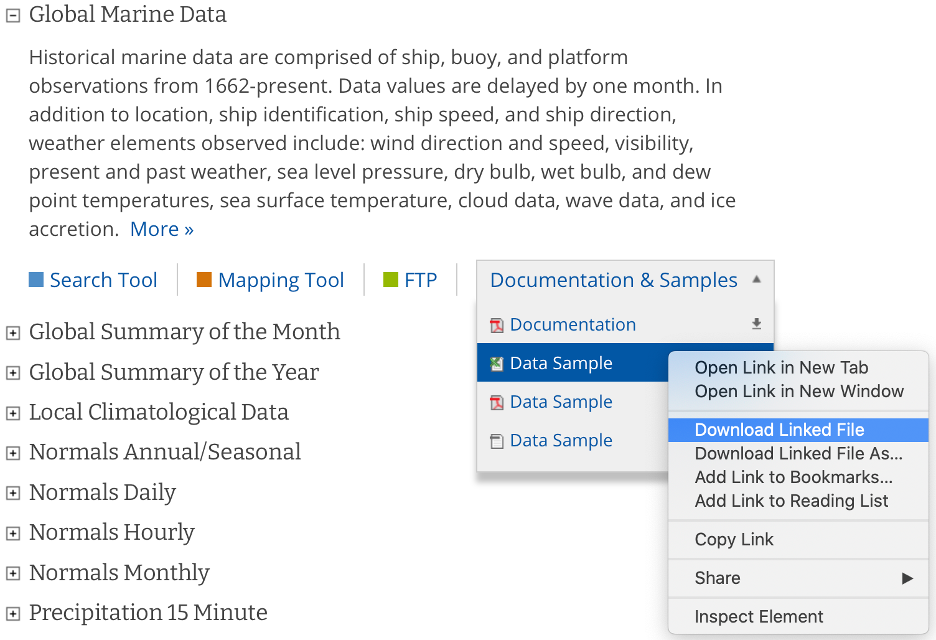
Navigate to https://www.ncdc.noaa.gov/cdo-web/datasets and download the documentation and a data sample from their global marine data section.
The documentation describes each variable in the sample dataset and will be extremely useful for updating our configuration file with the metadata for this dataset. The metadata we care most about are the units and user-friendly text descriptions of each variable, but we also need to be on the lookout for any inconsistencies or potential data problems that could complicate how we process this dataset. Take, for example, the following descriptions of the various temperature measurements that this dataset contains and note that the units are not necessarily the same between files in this dataset:
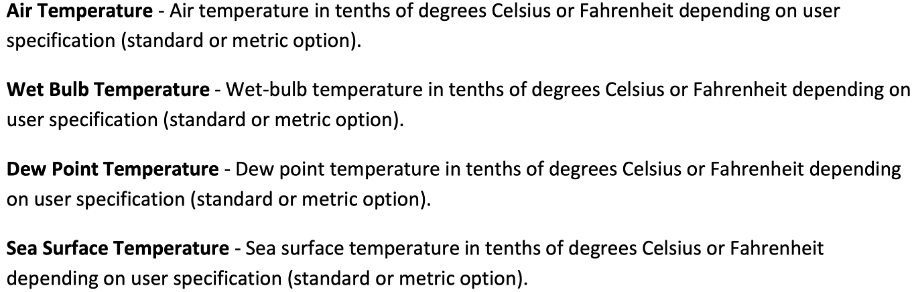
If we were collecting this data from multiple users, we would need to be aware of possible unit differences between files from different users and we would likely want to standardize the units so that they were all in Celsius or all in Fahrenheit (Our preference is to use the metric system wherever possible). If we examine this data, it appears that the units are not metric – how unfortunate. Luckily, this is something that can easily be fixed by using tsdat.
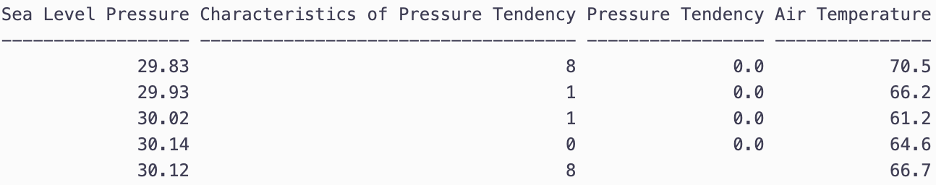
Selection from the sample dataset. It appears that units are recorded in the imperial system instead of the metric system – Sea Level Pressure is recorded in Hg instead of hPa (Hectopascal) and Air Temperature is recorded in degF (Fahrenheit) instead of degC (Celsius).
Creating a repository from a template
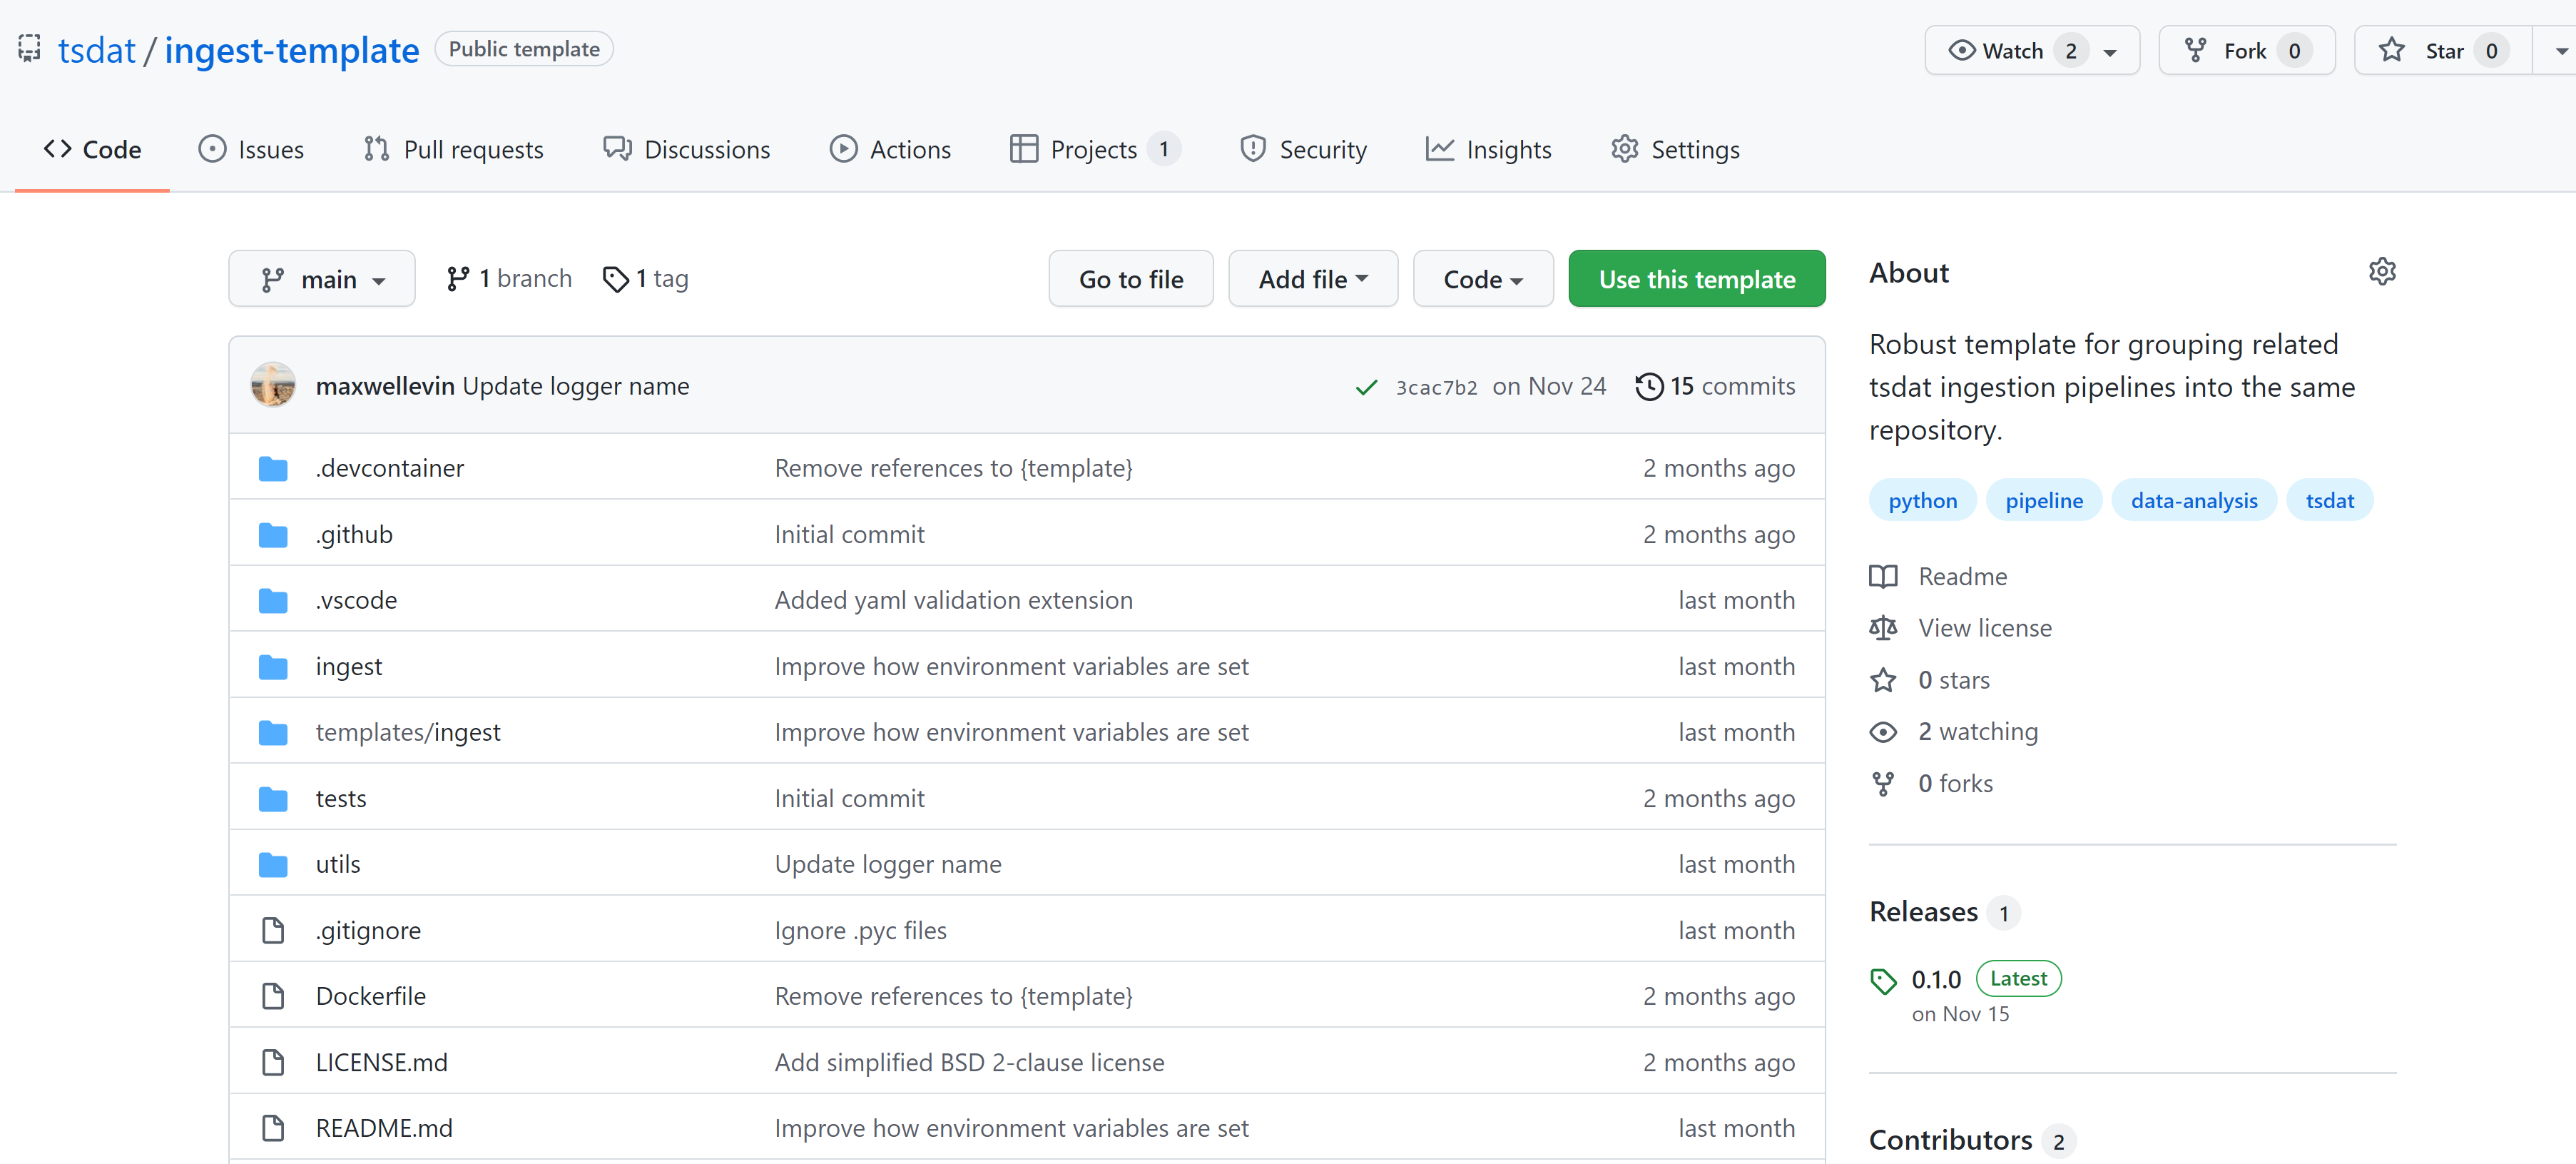
Now that we have the data and metadata that we will need, let’s move on to step #2 and set up a GitHub repository for our work. What we are looking to do is read in the NCEI “raw” data, apply variable names and metadata, apply quality control, and convert it into the netCDF format – an ‘ingest’, in other words. To do this, navigate to https://github.com/tsdat/pipeline-template and click “Use this template” (you must log into github to see this button).
This will open https://github.com/tsdat/pipeline-template/generate (you can also just open this link directly) which will prompt you to name your repository. Go ahead and fill out the information however you would like and set the visibility to your preference.
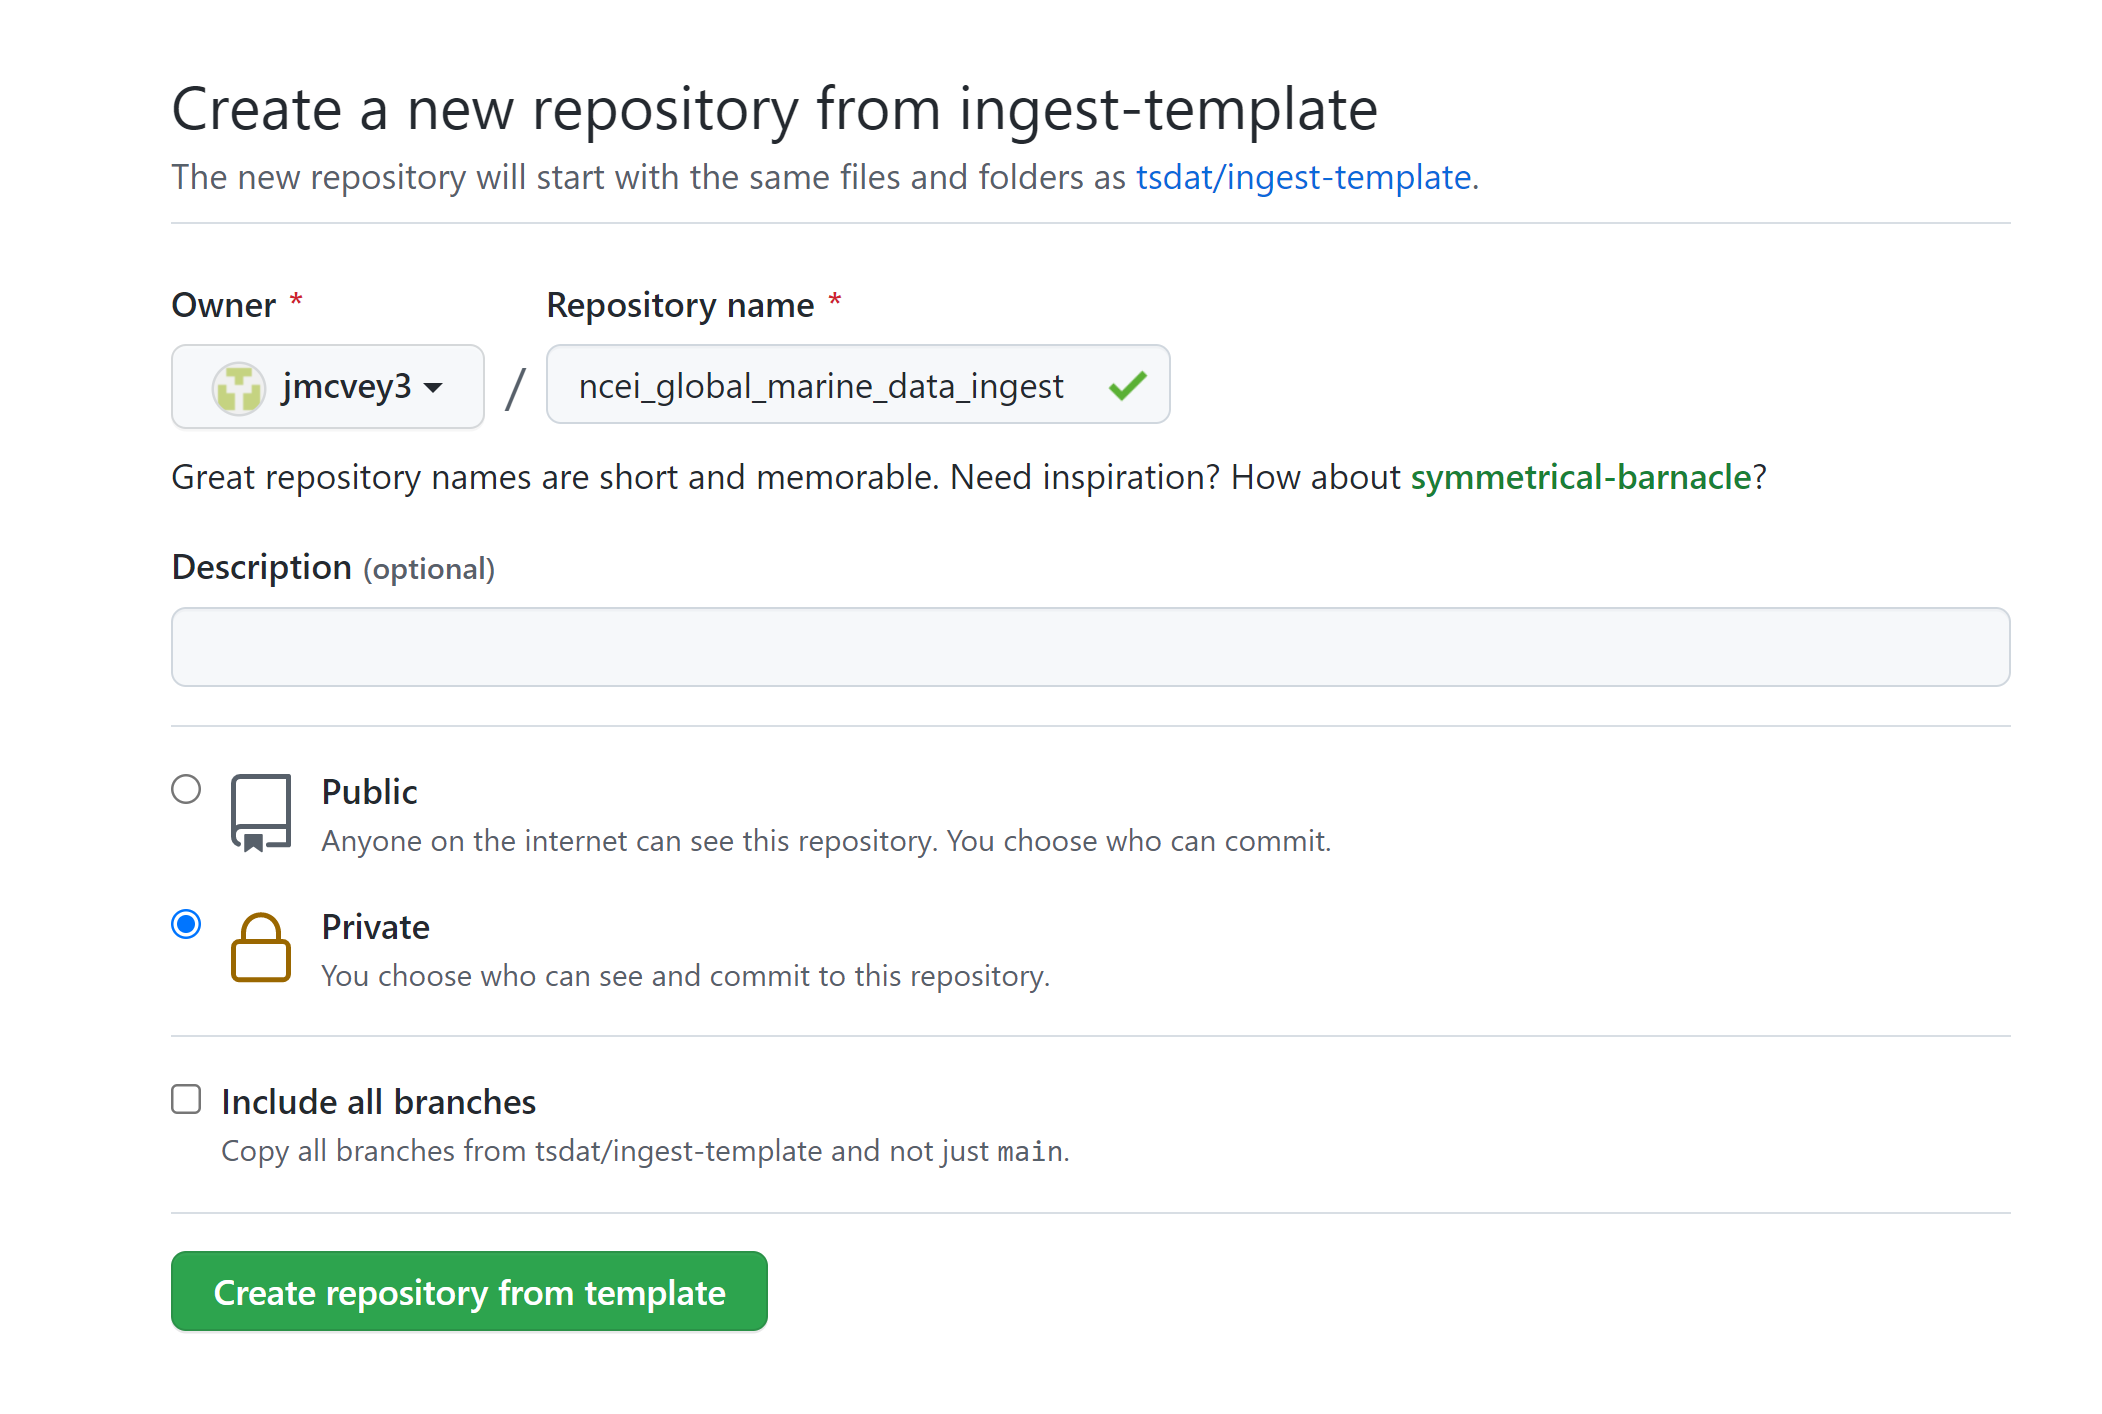
Example shown is titled “ncei-global-marine-data-ingest”.
Click “Create repository from template” to create your own repository that you can work in for this example.
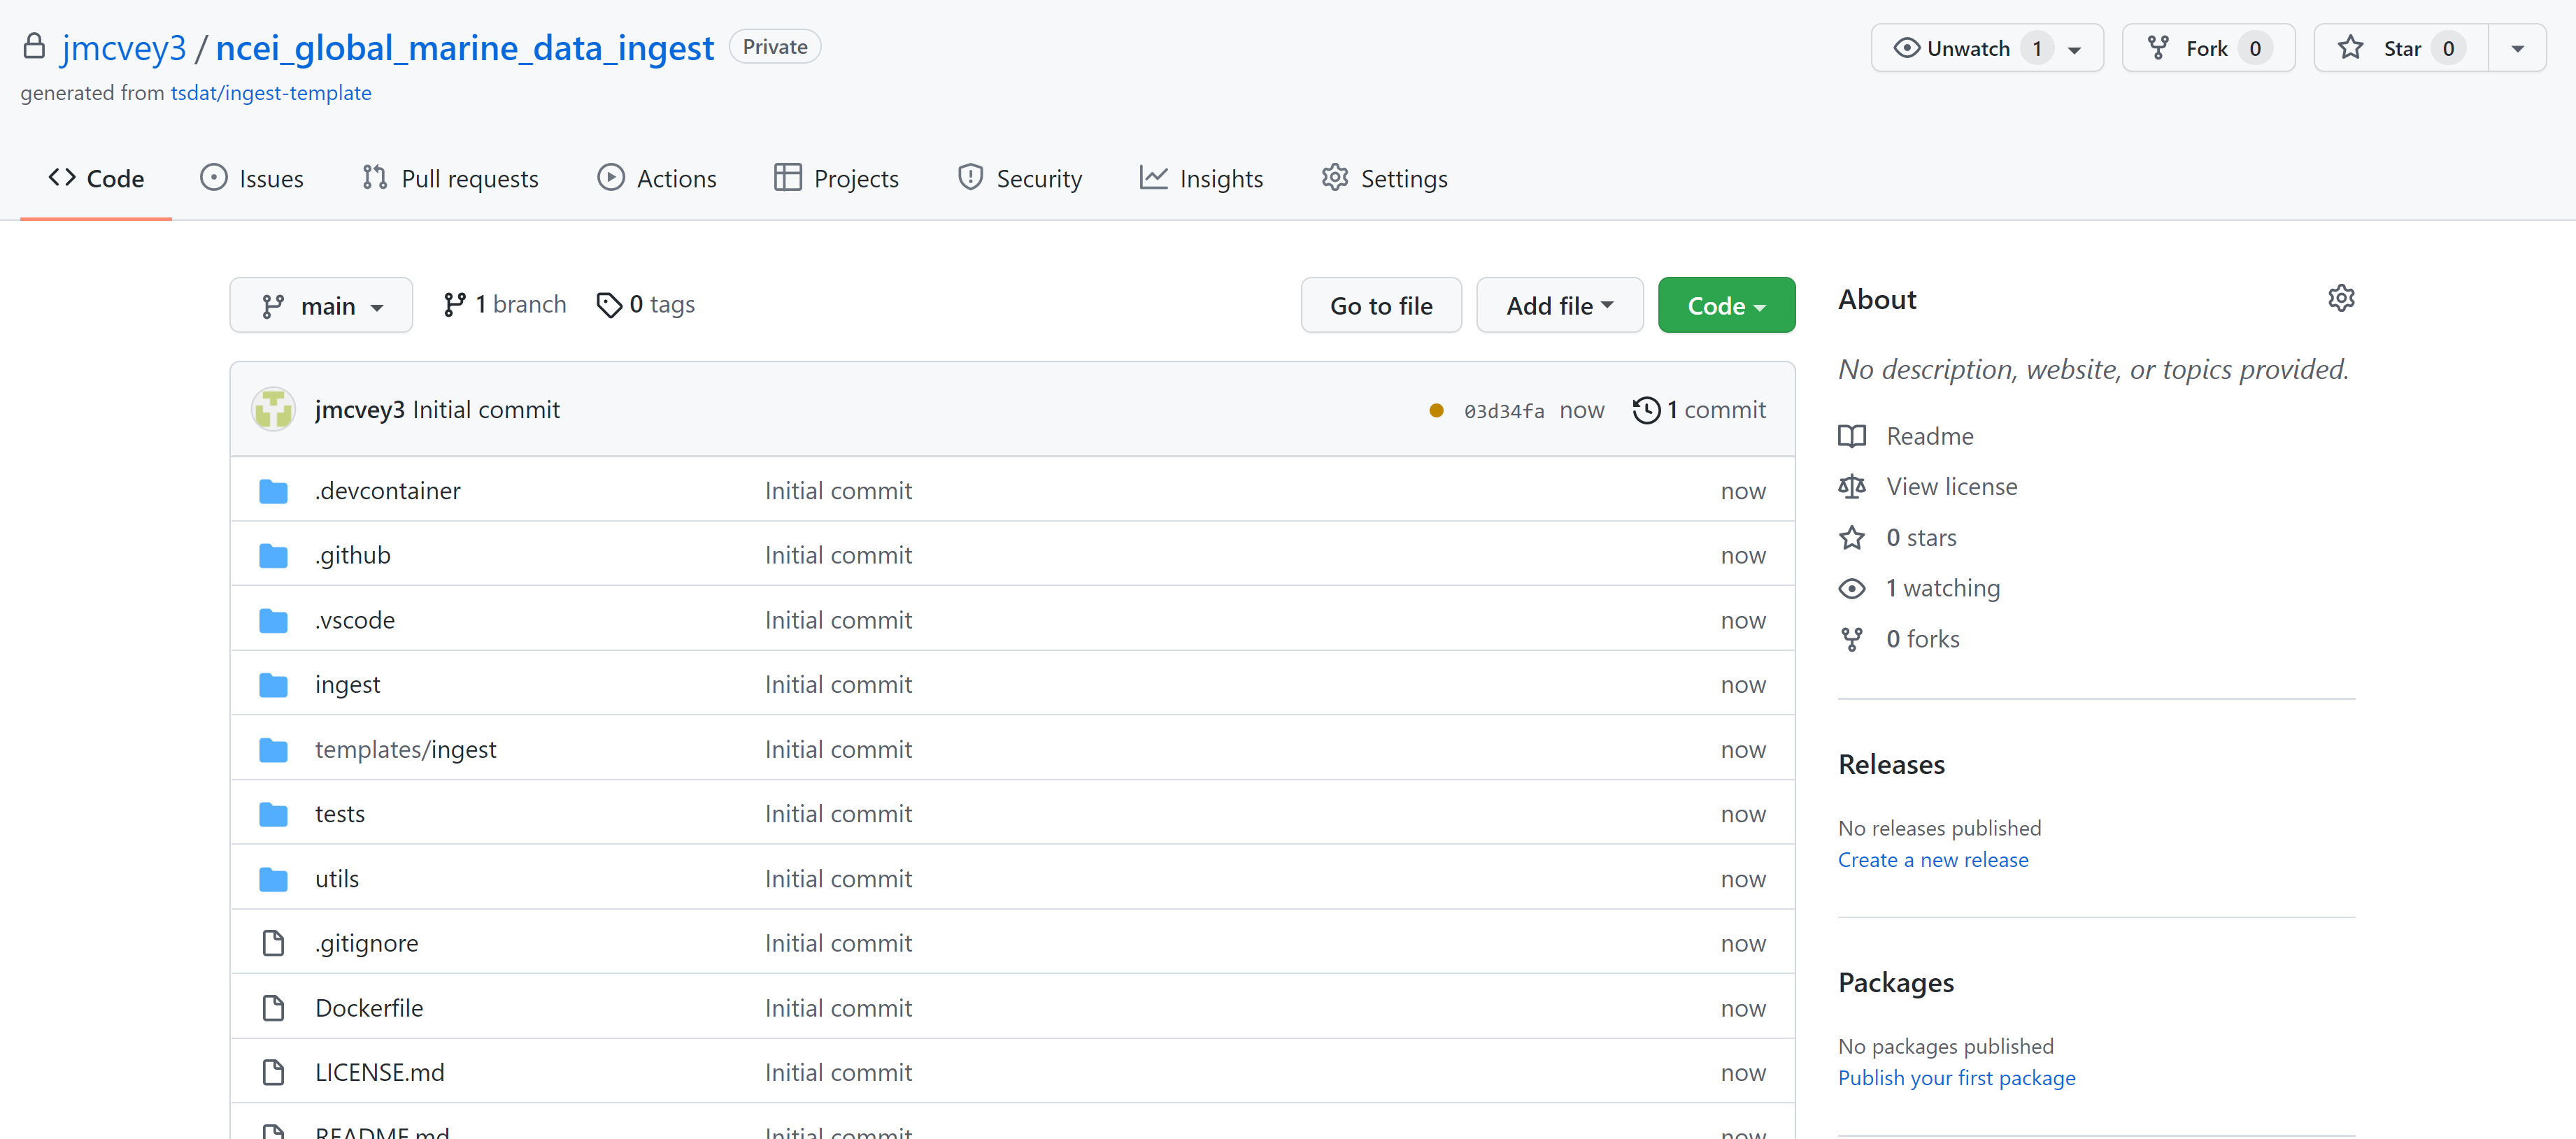
Go ahead and clone the repository to your local machine and open it up in whatever IDE you prefer.
Next install Python 3.8+ if you haven’t already done so and create an environment in which to manage your project’s dependencies. You can download and install Python here: https://www.python.org. When developing with intent to deploy to a production system, we recommend managing your environment using a Docker Container or an Anaconda environment.
Setting up a Docker Container and VS Code
Because Tsdat support for Windows machines is currently limited (and I have a windows machine), I’ll show how you to set up tsdat in VSCode using tsdat’s Docker setup. This setup is recommended because it creates a self-contained development environment and is pretty user-friendly.
Start by installing Docker and VSCode. It’s a good idea to familiarize yourself with the VScode interface, and feel free to go through Docker’s initial tutorial after installation. It goes through basics on setting up a Docker “engine” to make sure it’s working - you don’t need to know how to do this (or really anything in Docker) to use Tsdat.
Once you have VS Code and Docker downloaded and installed:
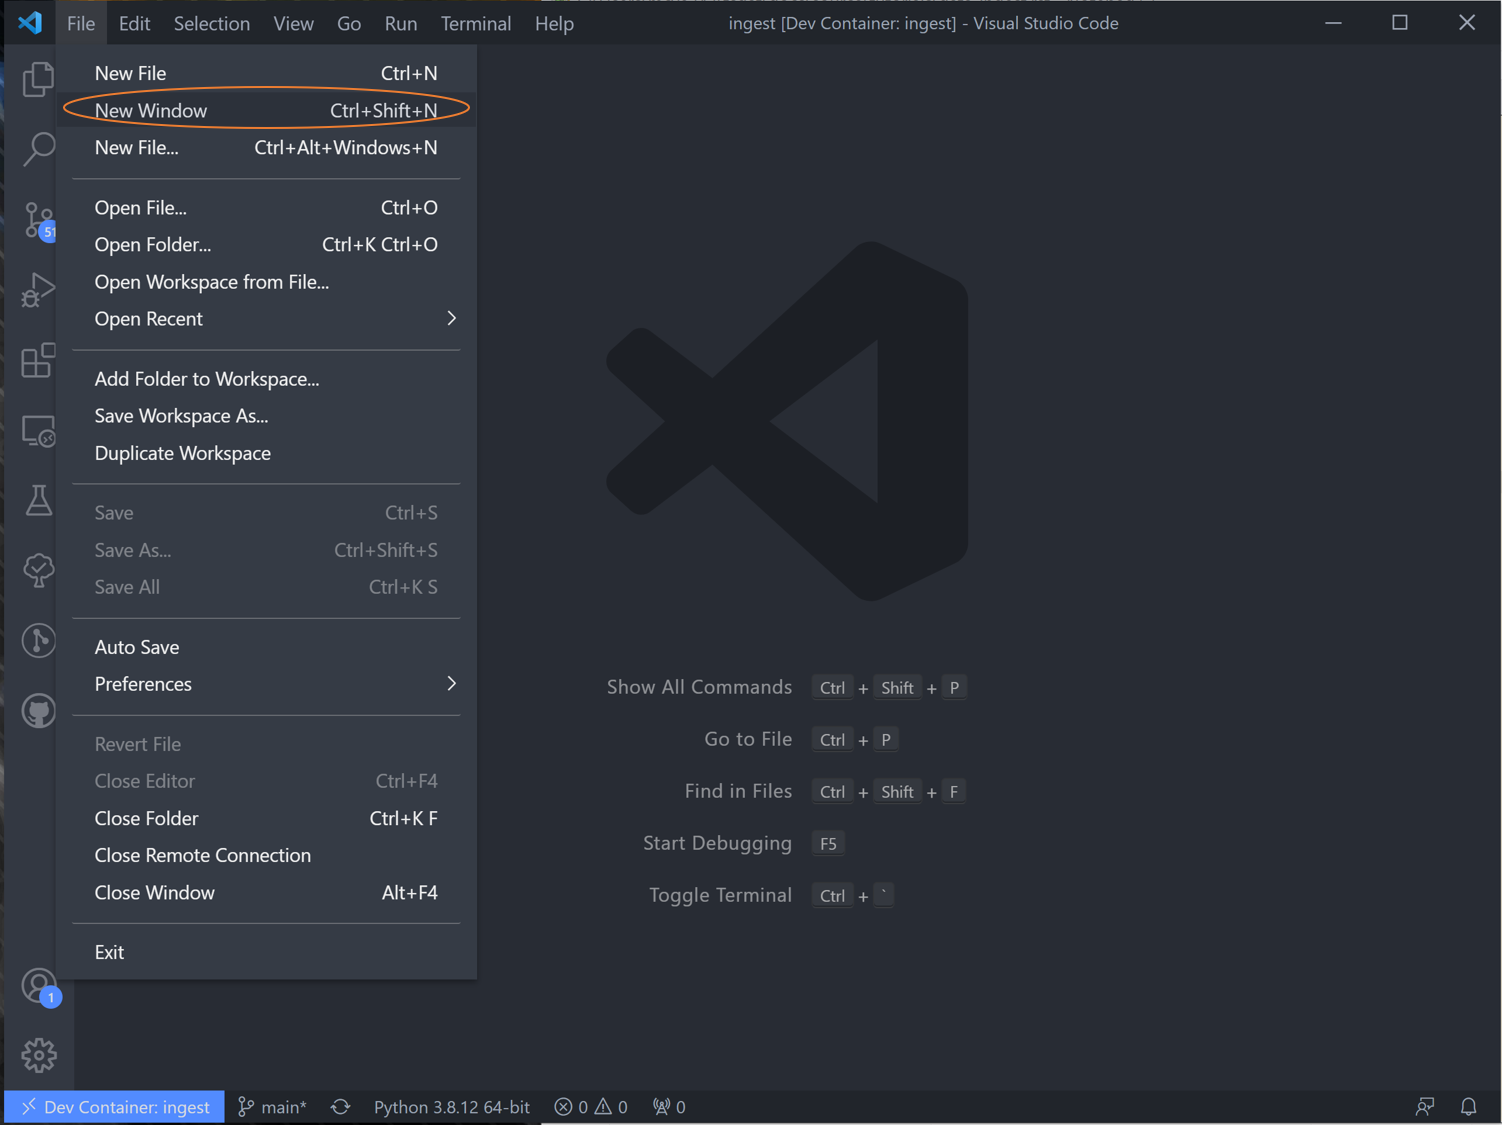
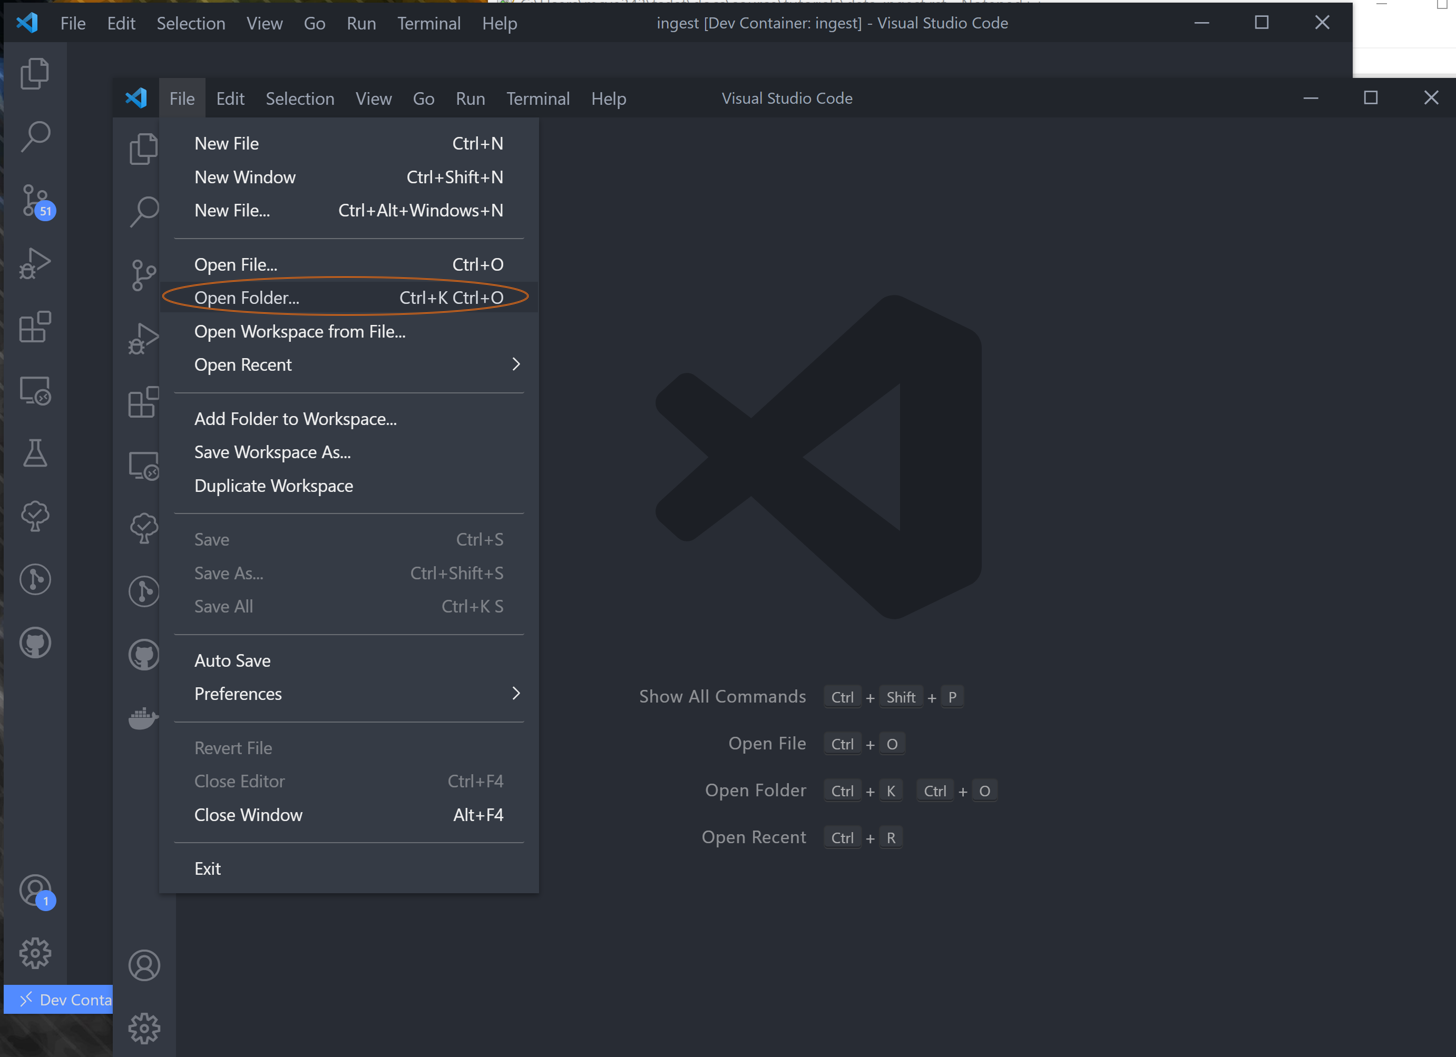
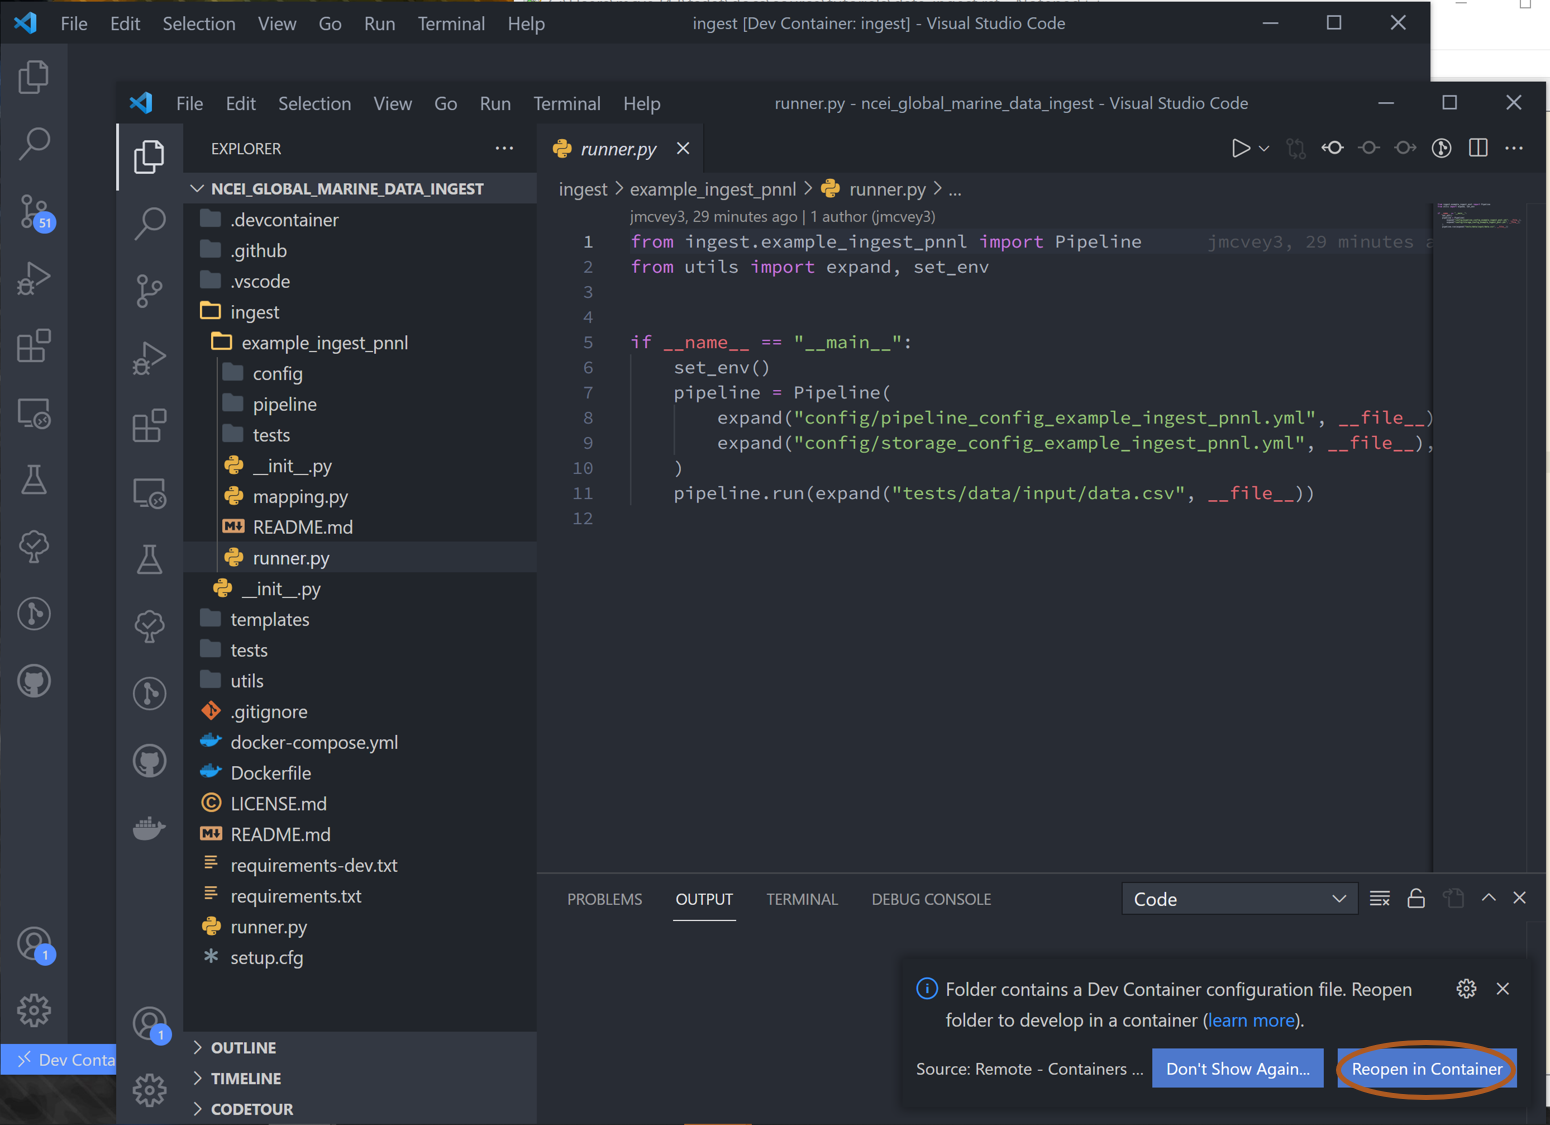
Open VSCode -> New Window -> Open Folder -> open cloned template folder (“ncei_global_marine_data_ingest”)
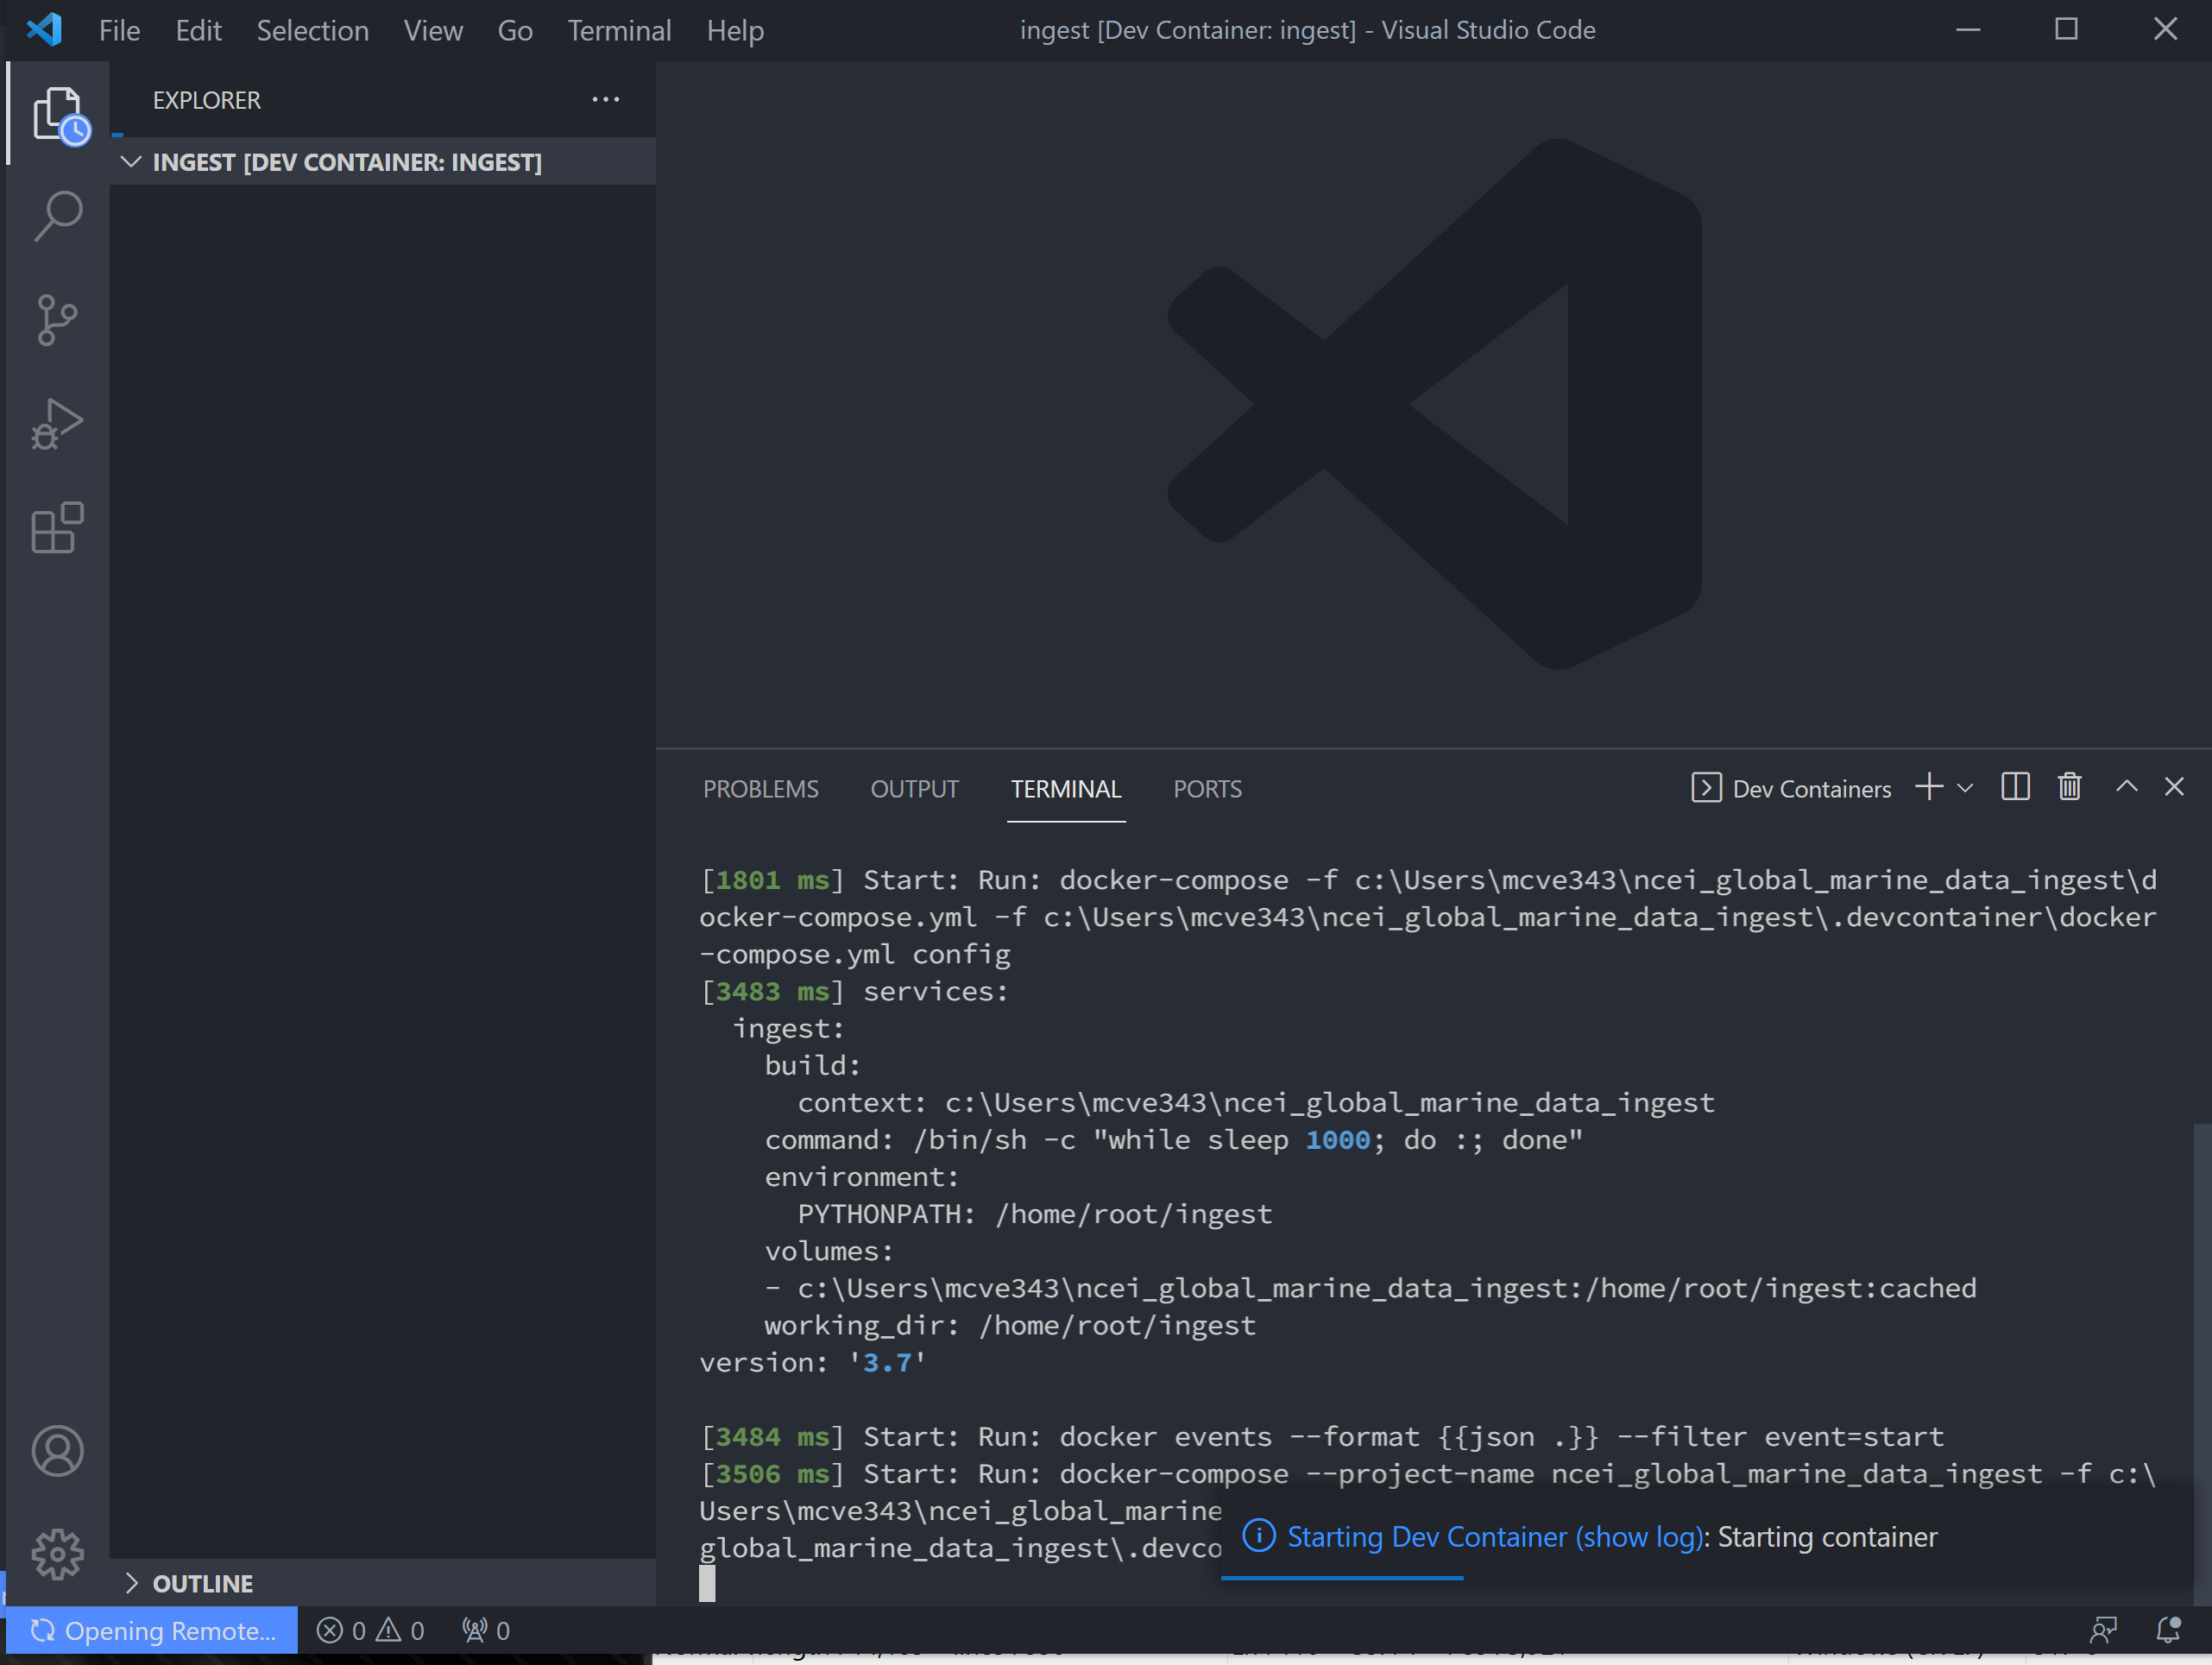
VSCode will prompt you if you want to open in Docker -> Click yes and wait for docker to initiate, which takes a minute or two.
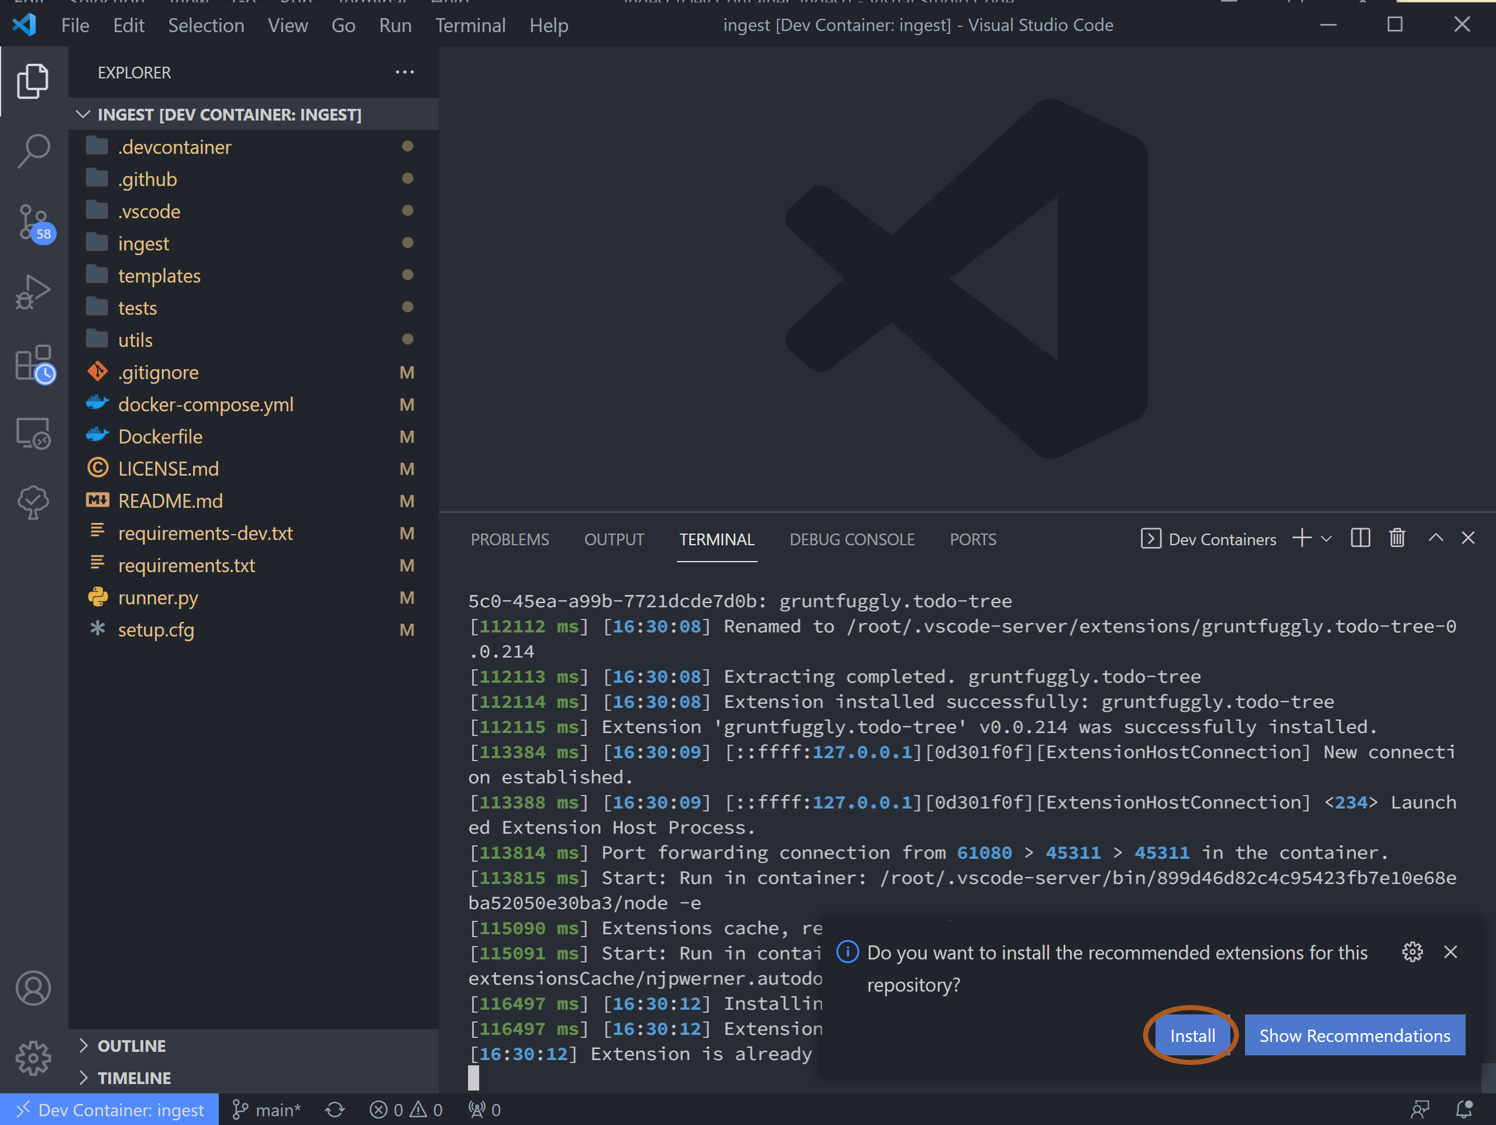
VSCode will prompt if you want to install dependencies -> Hit install; you can close the new windows it opens
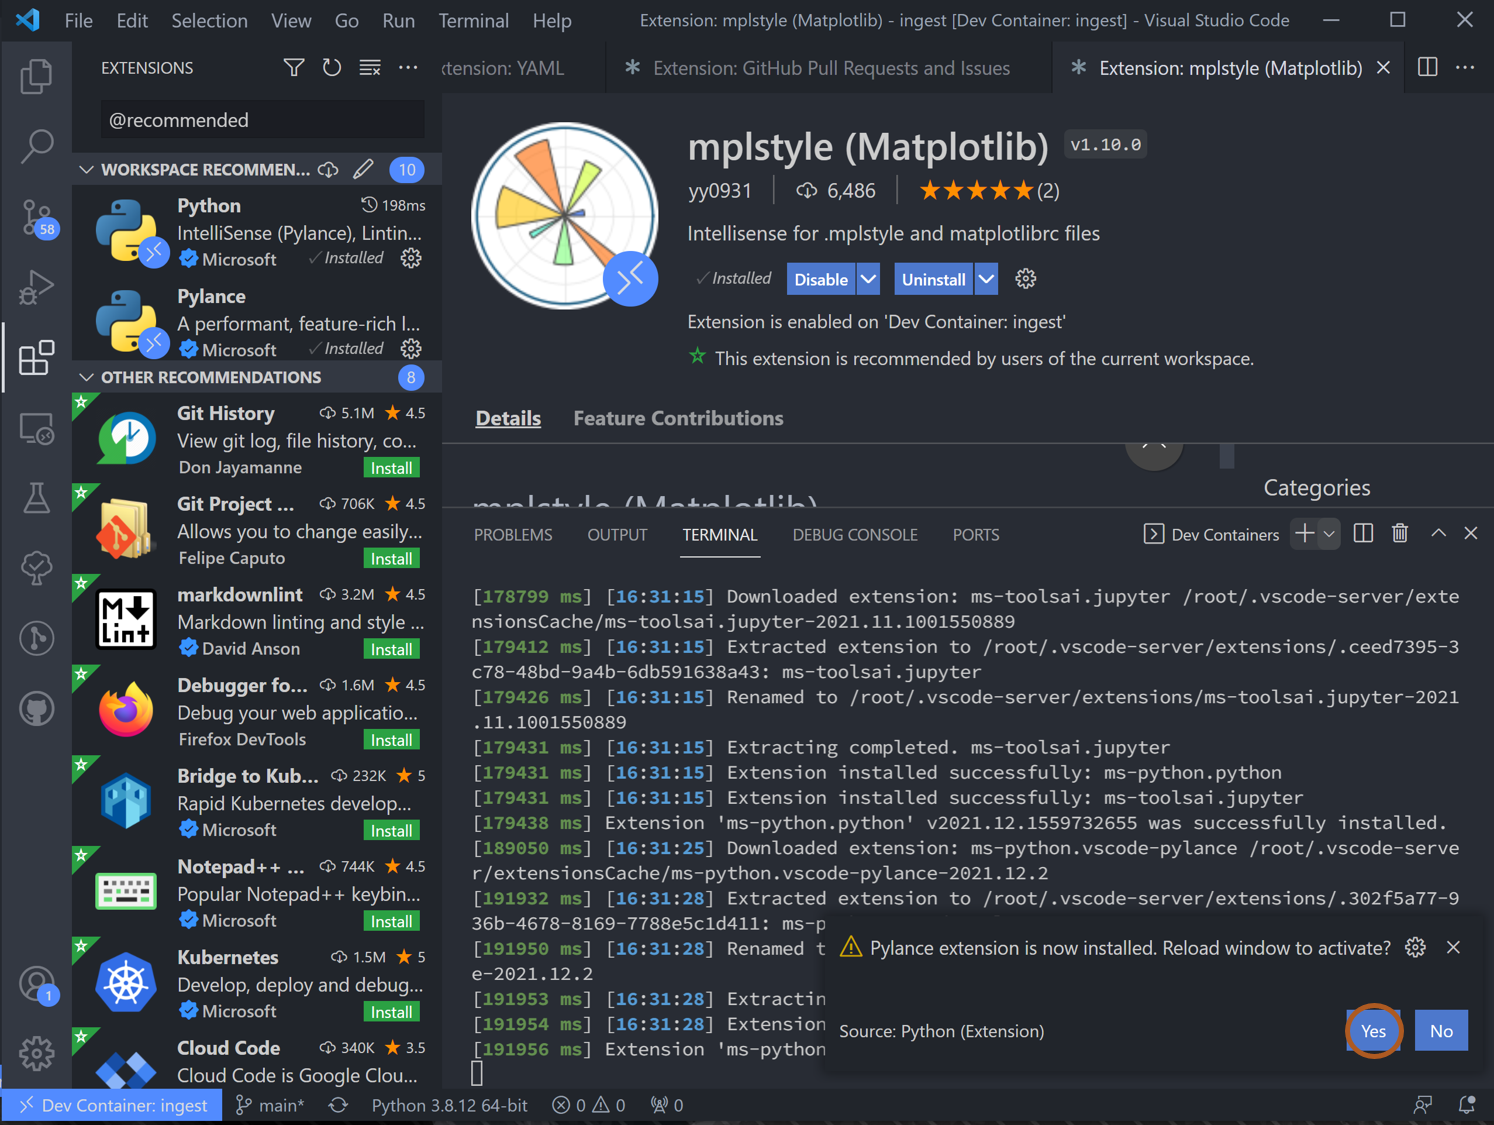
VS Code will then prompt you to restart window after pylance is installed -> Hit yes again and VS Code will reboot
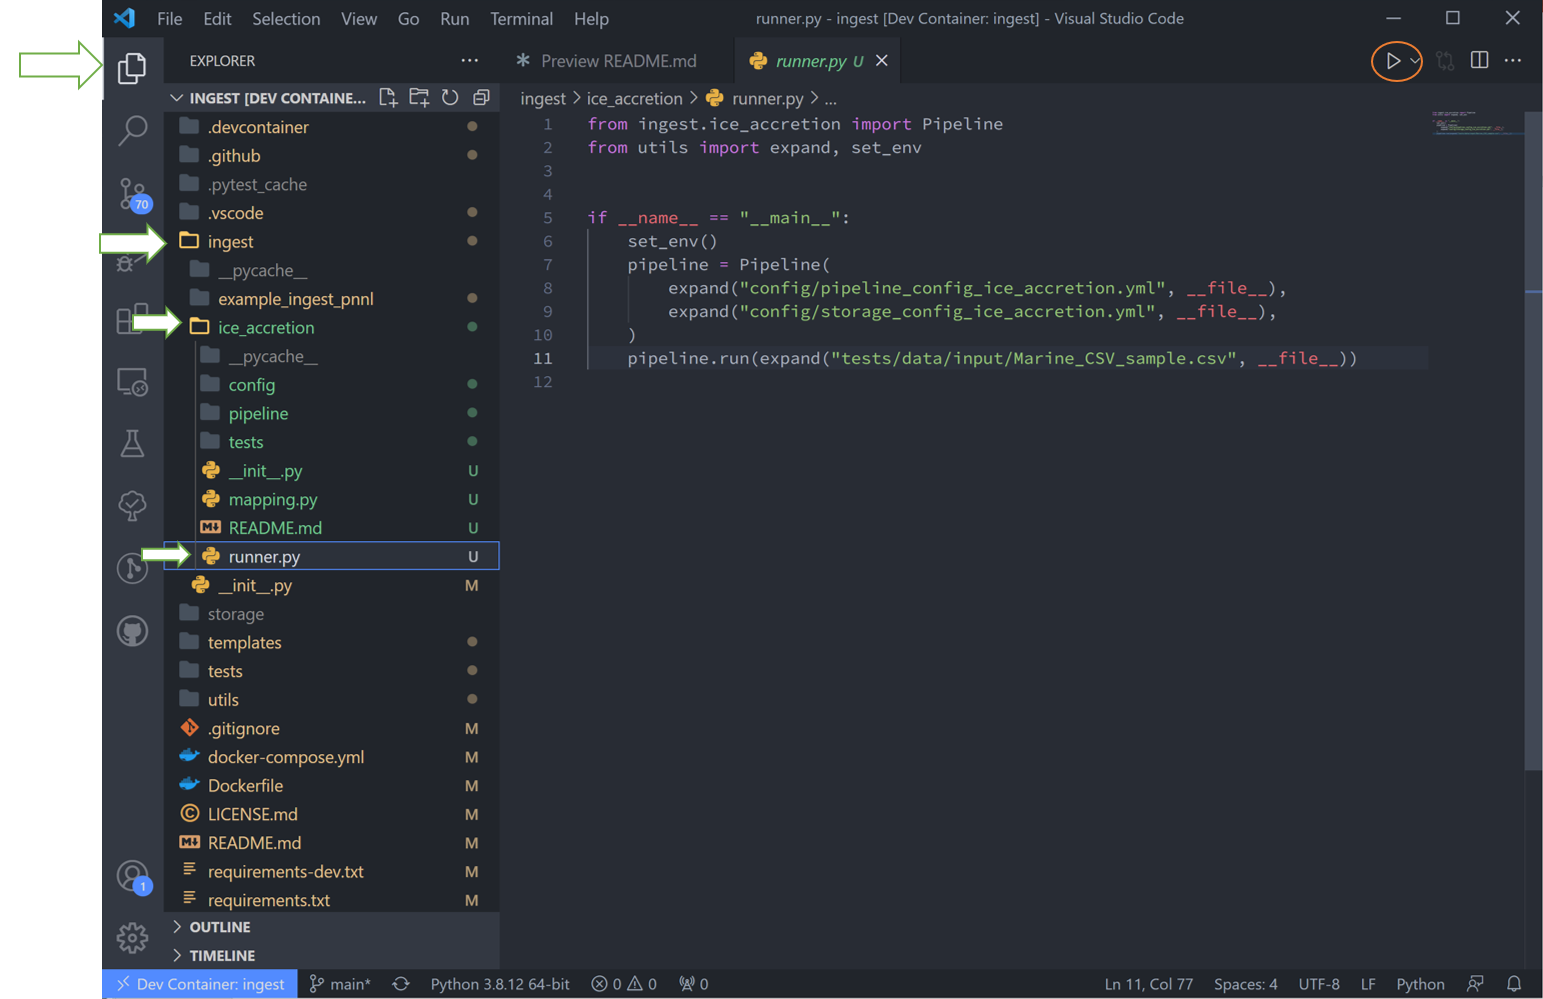
Congrats! Python environment handling done. Open the “Explorer” tab to see folder contents for the next step:
A few quick things on VSCode: in the left-hand toolbar, we will use the “Explorer”, “Search”, “Testing”, and “TODO tree” icons in this tutorial. Also useful to know are the commands “ctrl `” (toggle the terminal on/off) and “ctrl shift P” (open command search bar).
Run the Basic Template
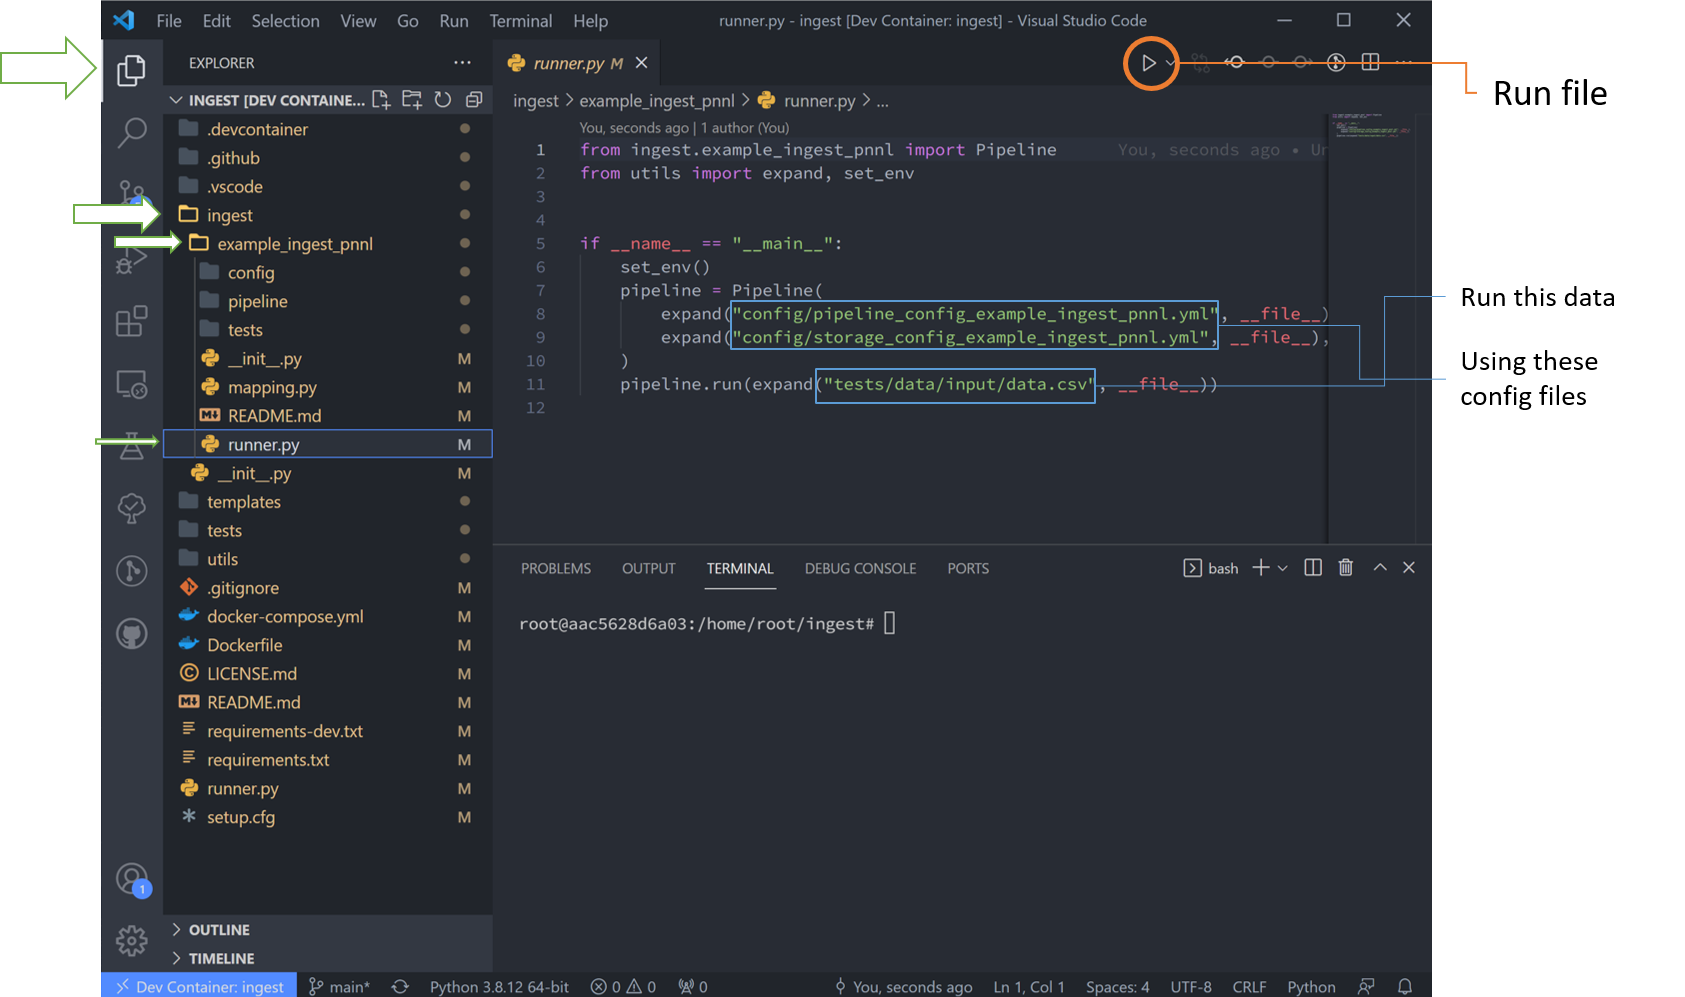
Navigate to the “runner.py” file and run it. This will run the basic example stored in the template. Notice the data here is stored in the “tests” folder, but can be located anywhere that the user desires.
After the code runs, there won’t be any particular output in the terminal window. Notice that a new storage/ folder is created with the following contents:
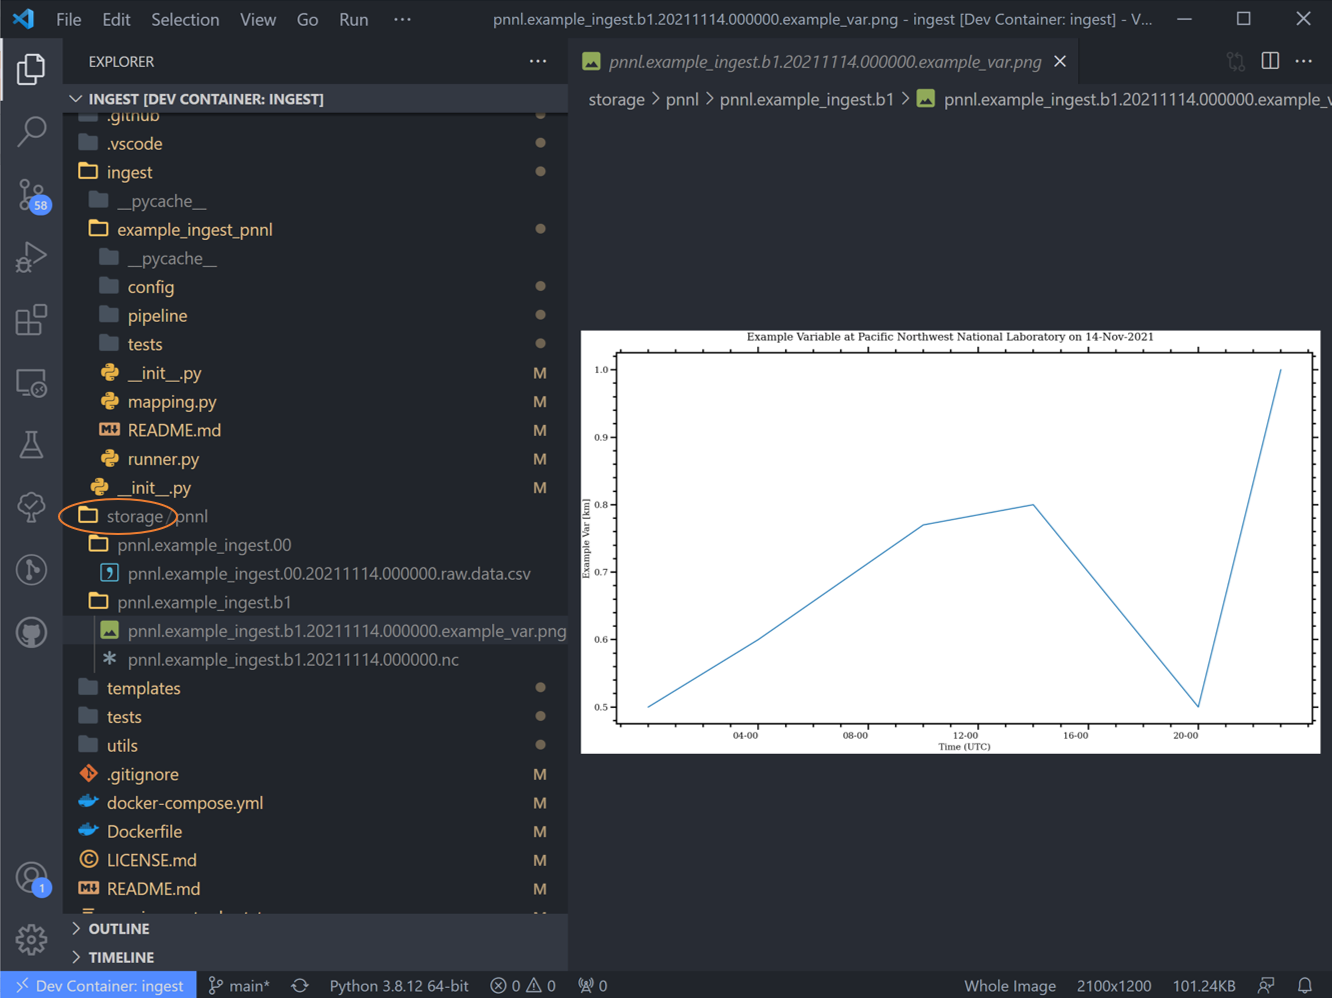
These files contain the outputs of the ingest pipeline example. Note that there are two subdirectories here – one ends in “.00” and the other ends with “.a1”. This ending is called the “data level” and indicates the level of processing of the data, with “00” representing raw data that has been renamed according to the data standards that tsdat was developed under, “a1” refers to data that has been standardized, but no quality control has been applied, and “b1” representing data that has been ingested, standardized, and quality-controlled.
For more information on the standards used to develop tsdat, please consult our data standards.
Creating a New Ingest
Now that all the setup work is done, let’s start working on ingesting the NCEI data.
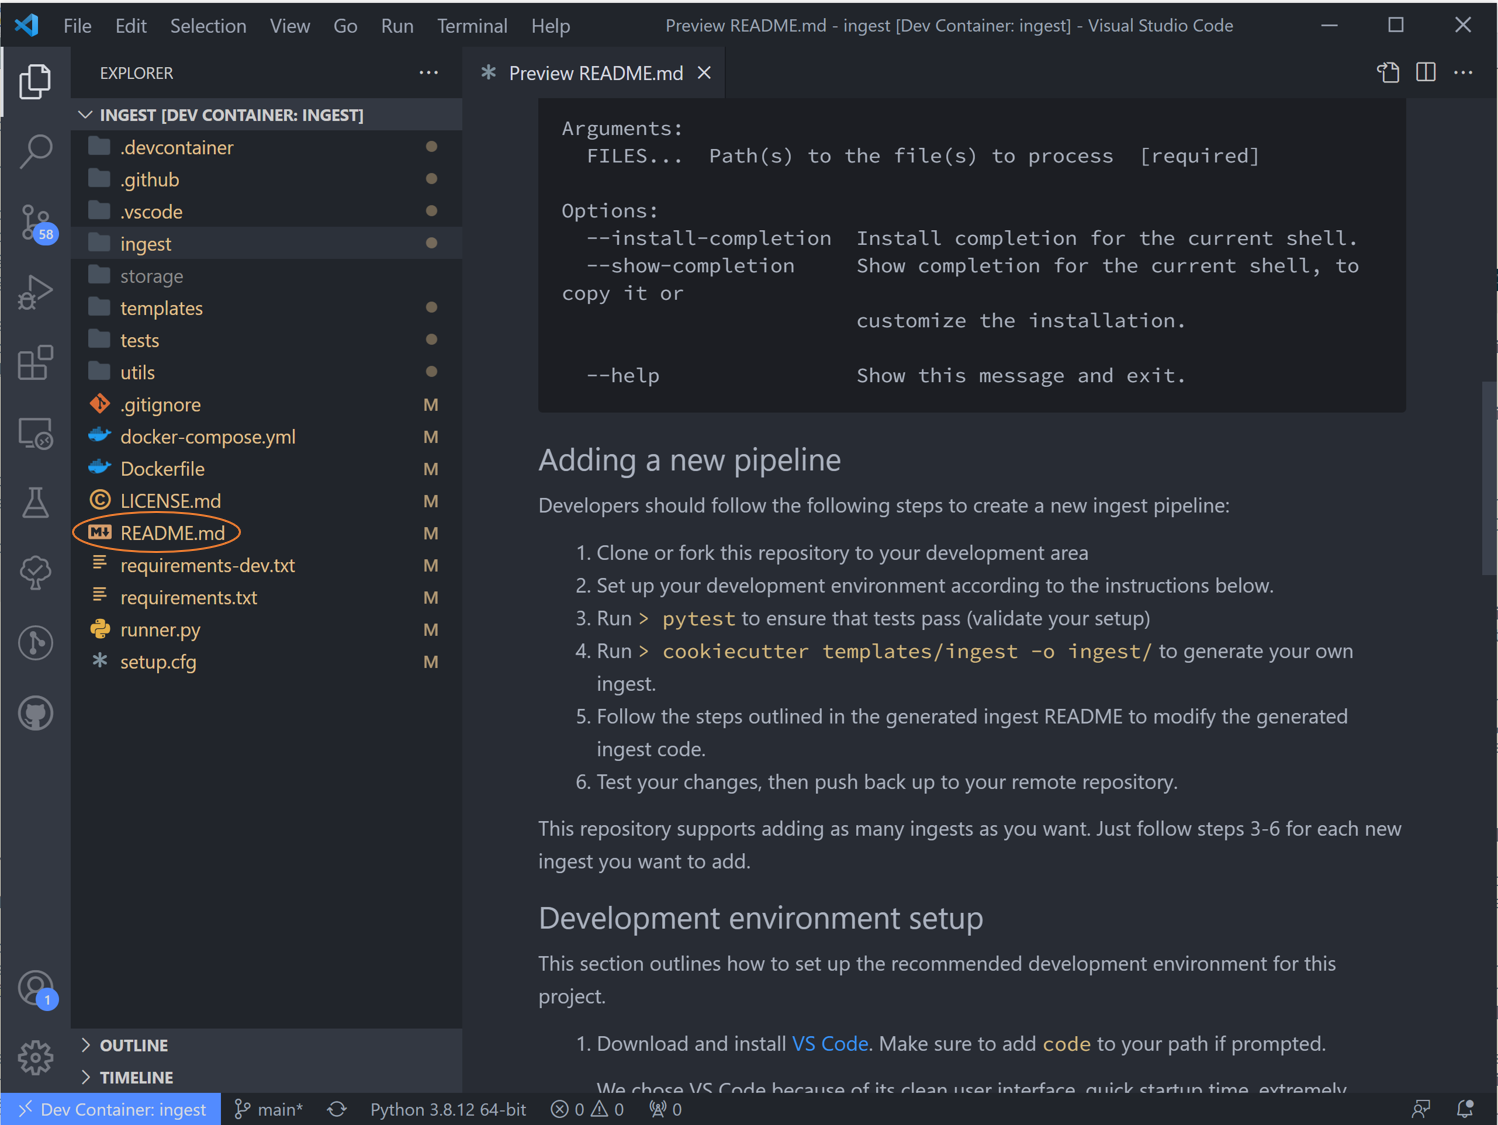
In the Explorer window pane you’ll see a list of all folders and files in this ingest -> right click on the top level README.md and select “open preview”. The steps in this readme we are more or less following in this tutorial.
Scroll down to “Adding a pipeline”. We have already done steps 1 and 2.
Looking at Readme step #3, we’ll run a quick test of the pipeline to make sure everything is set up properly. Navigate to “Testing” and run all tests using the “Play” icon by hoving over the “ingest” dropdown. Tsdat will automatically configure these tests, and they all should pass at this point in time.
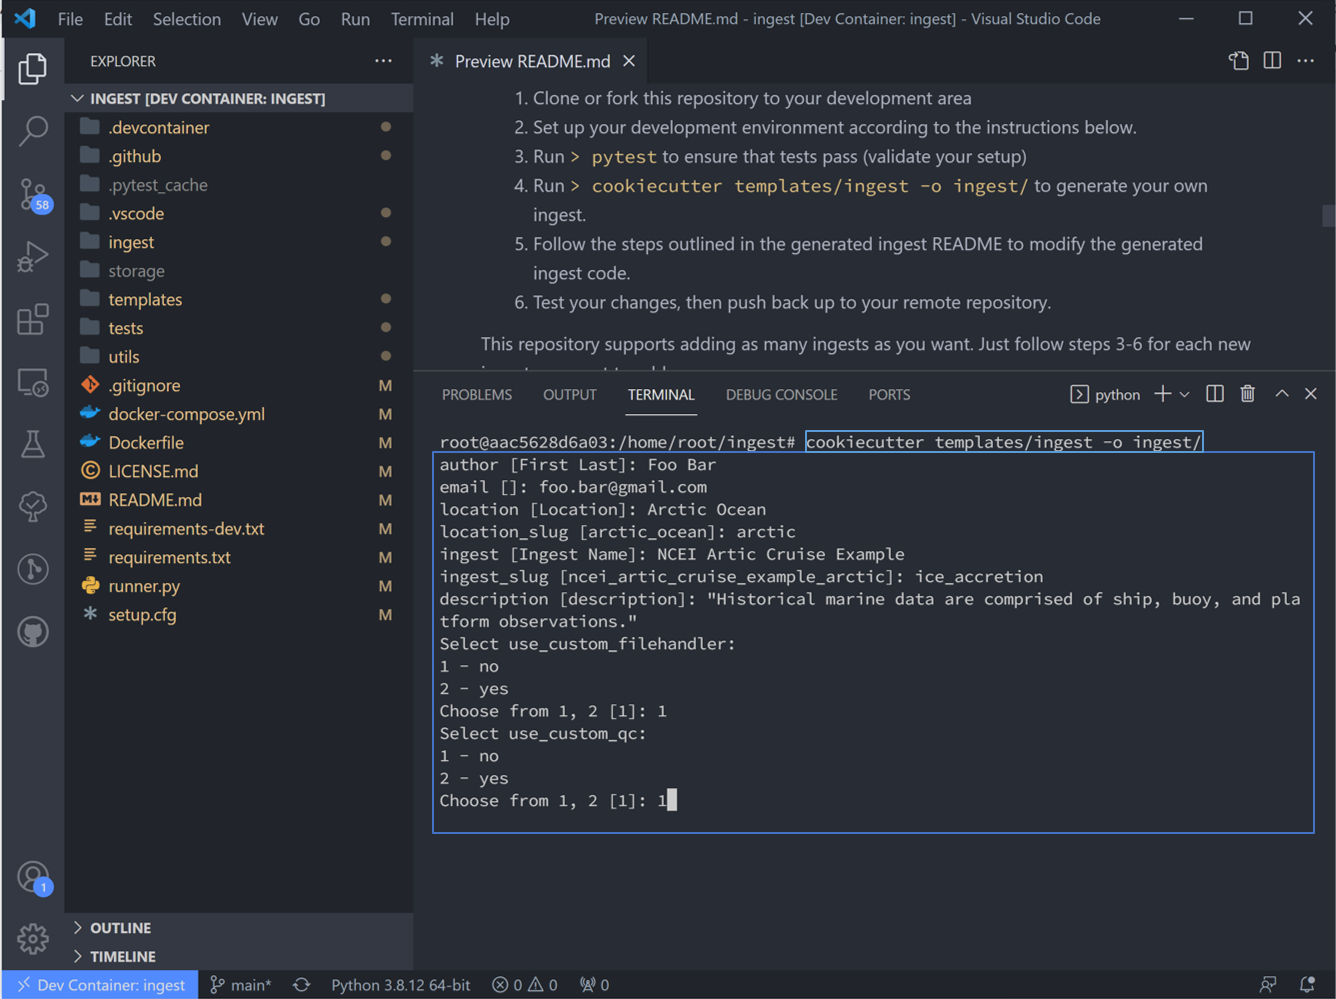
4. Looking at Readme step #4: Navigate back to the “Explorer” pane and hit “ctrl `” to open the terminal. Create a new ingest by running the following code in the terminal:
cookiecutter templates/ingest -o ingest/
There will follow a series of prompts that’ll be used to auto-fill the new ingest. Fill these in for the particular dataset of interest. Note: the term “slug” here means directory names. For this ingest we will not be using custom QC functions or custom file handlers, so select no for those as well. (See Custom QC & file handler tutorial for those)
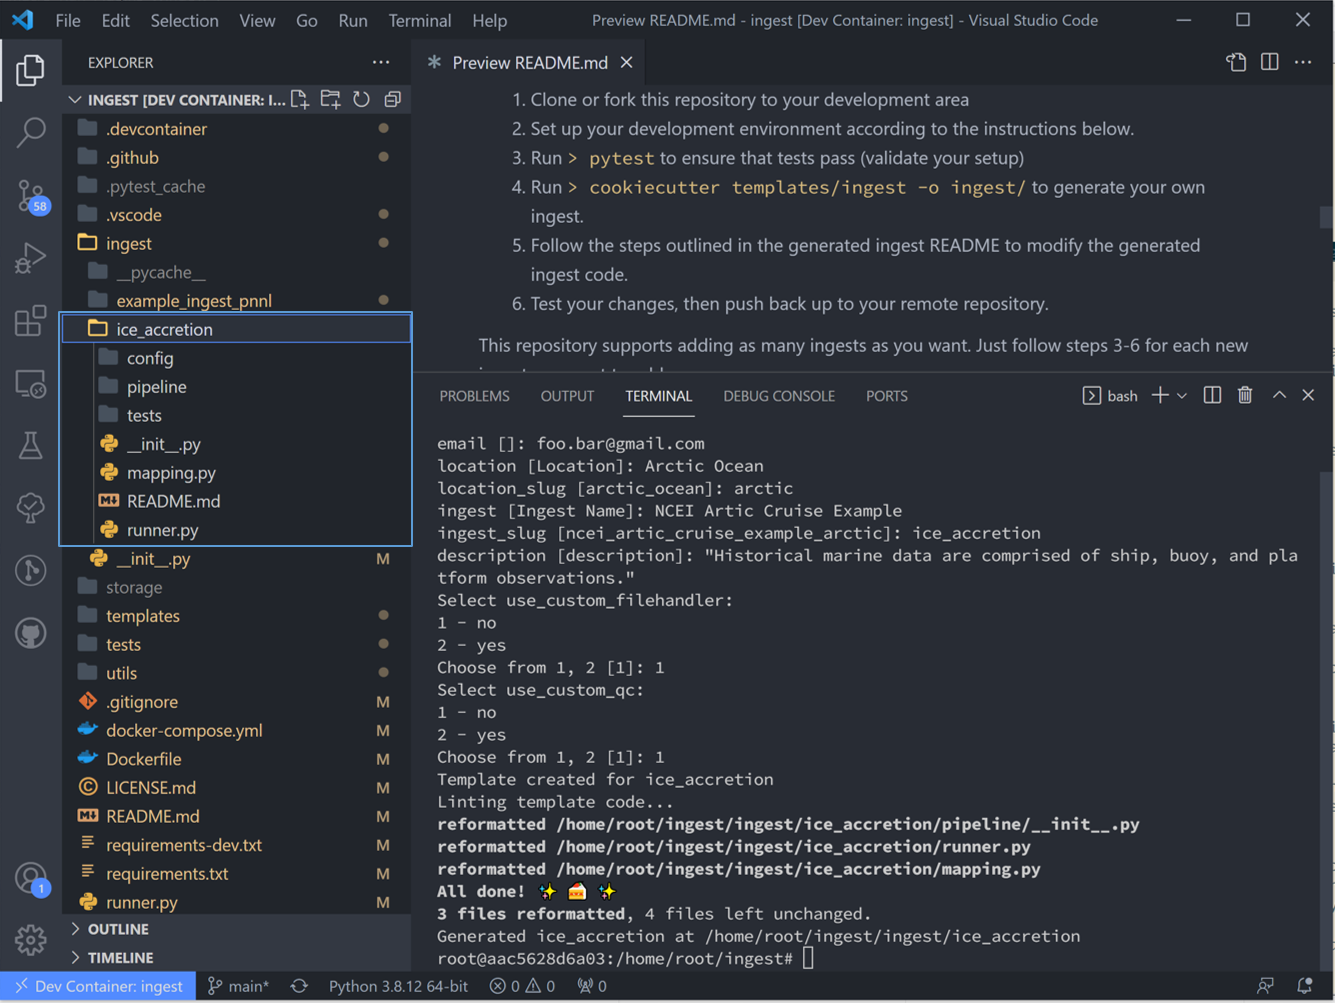
Once you fill that list out and hit the final enter, Tsdat will create a new ingest folder named with <ingest_slug>, in this case “ice_accretion”:
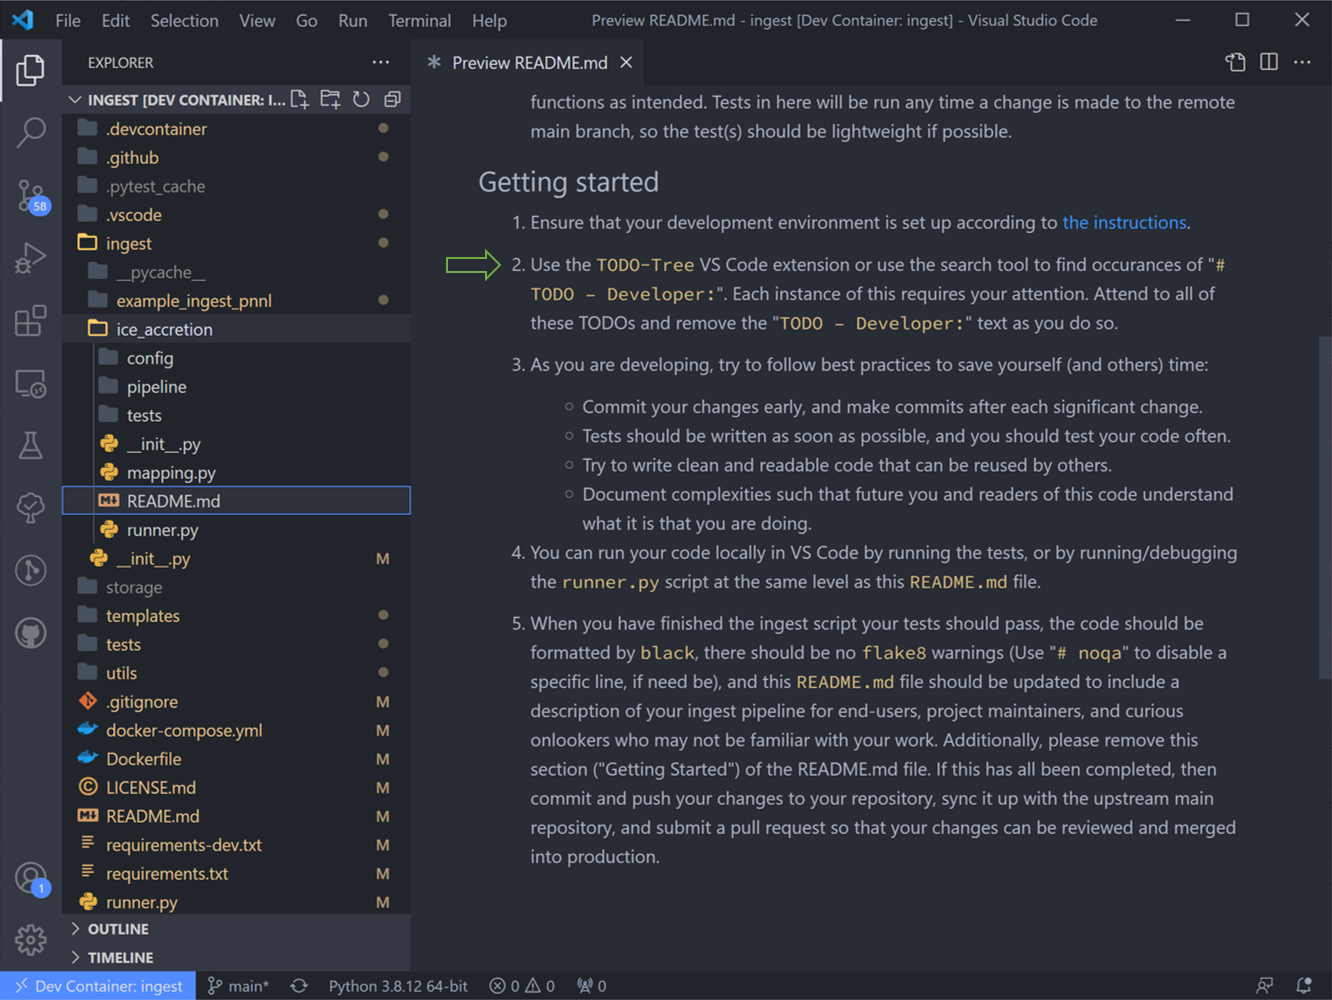
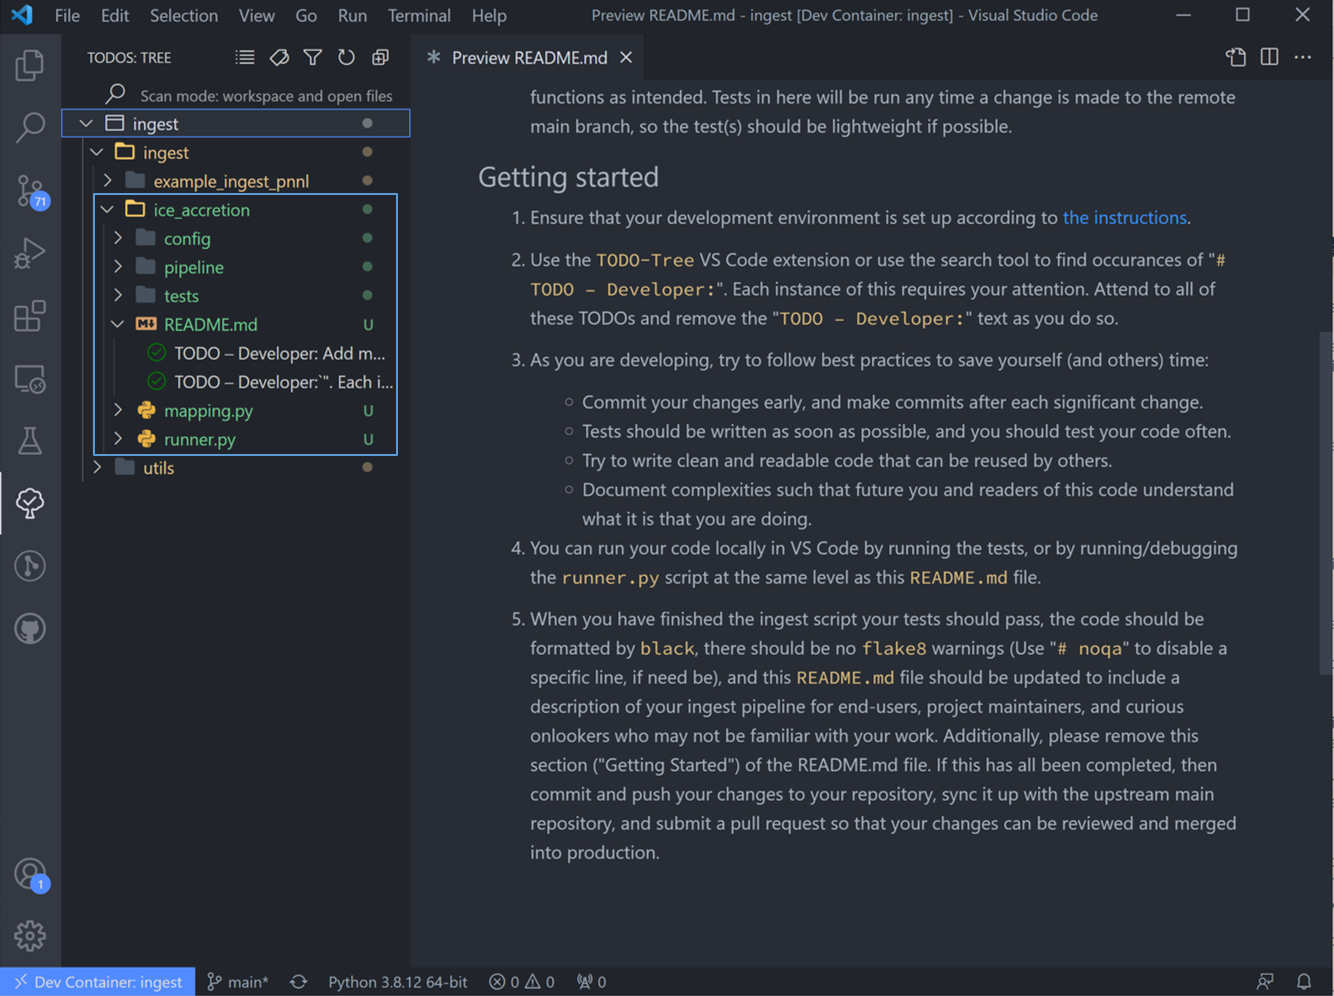
5. Right-click the README.md in our new “ice_accretion” ingest and “open-preview”. We are now looking at step #2: Use the “TODO tree” extension or use the search tool to find occurances of “# TODO-Developer”. (We have in fact followed the instructions in this step #1 already, if you were curious.)
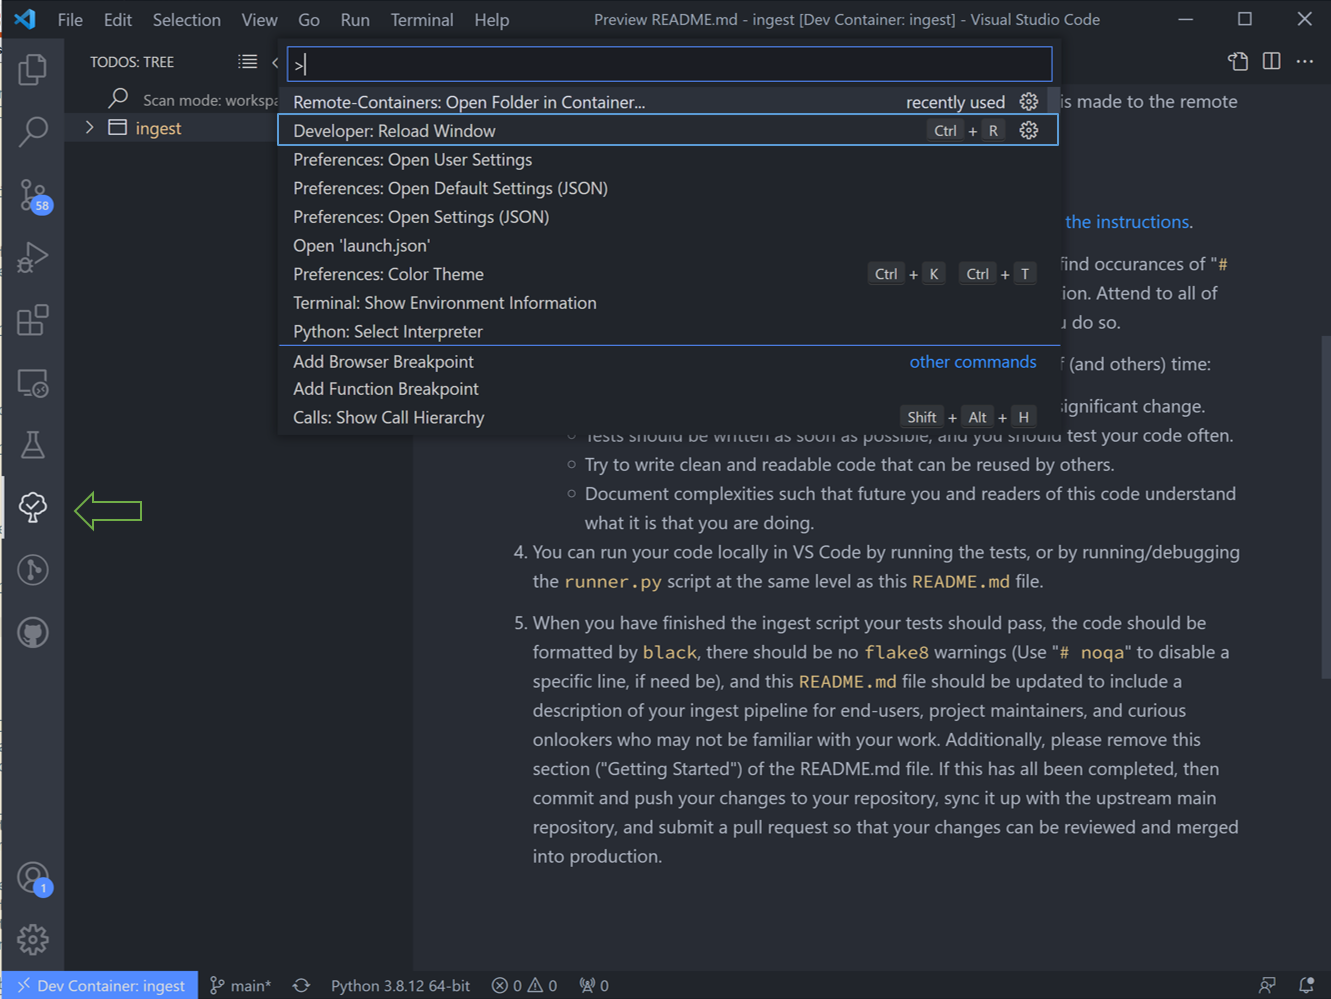
6. The “TODO tree” lists every literal “TODO” instance in the code, and we are looking in particular for “TODO - Developer”. (The “TODO tree” is in fact the oak tree icon in the left-hand window pane).
You’ll need to reload VS Code for these to show up in the ingest. Hitting “ctrl shift P” on the keyboard to open the search bar, and type in and run the command “Reload Window”.
After doing the window reloads, all the newly created “TODOs” will show up in the new ingest folder.
Customizing the New Ingest
Each ingest folder is particular to a specific datafile, so we must customize our ingest to our particular datafile. The following section describes how to customize a pipeline for our historical ship data, following the TODOs list.
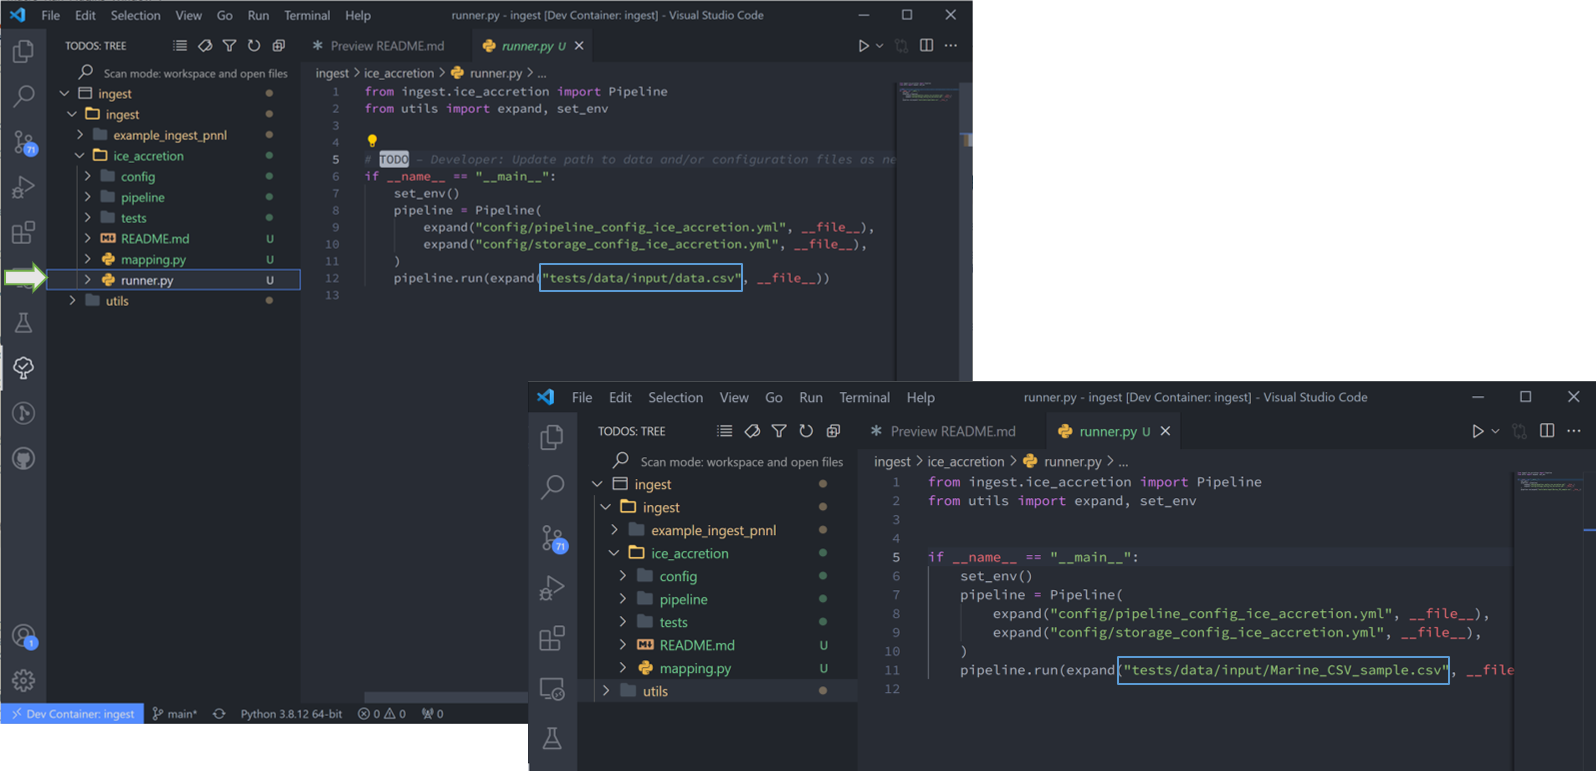
7. Let’s start with “runner.py”. This “TODO” states ‘Update path to data and/or configuration files as needed.’ As you can see, the cookiecutter command auto-filled the configuration filenames, so all we need to do is replace the input data. Once done, delete the “TODO” and it disappears from the list.
Raw datafiles can be stored anywhere (but here I have moved it to the tests/data/input/ folder), so long as the run_pipeline command is referenced to the correct location. Also be sure to delete any other files not to be read through the pipeline from the data folder. Tsdat will try to run these and will fail.
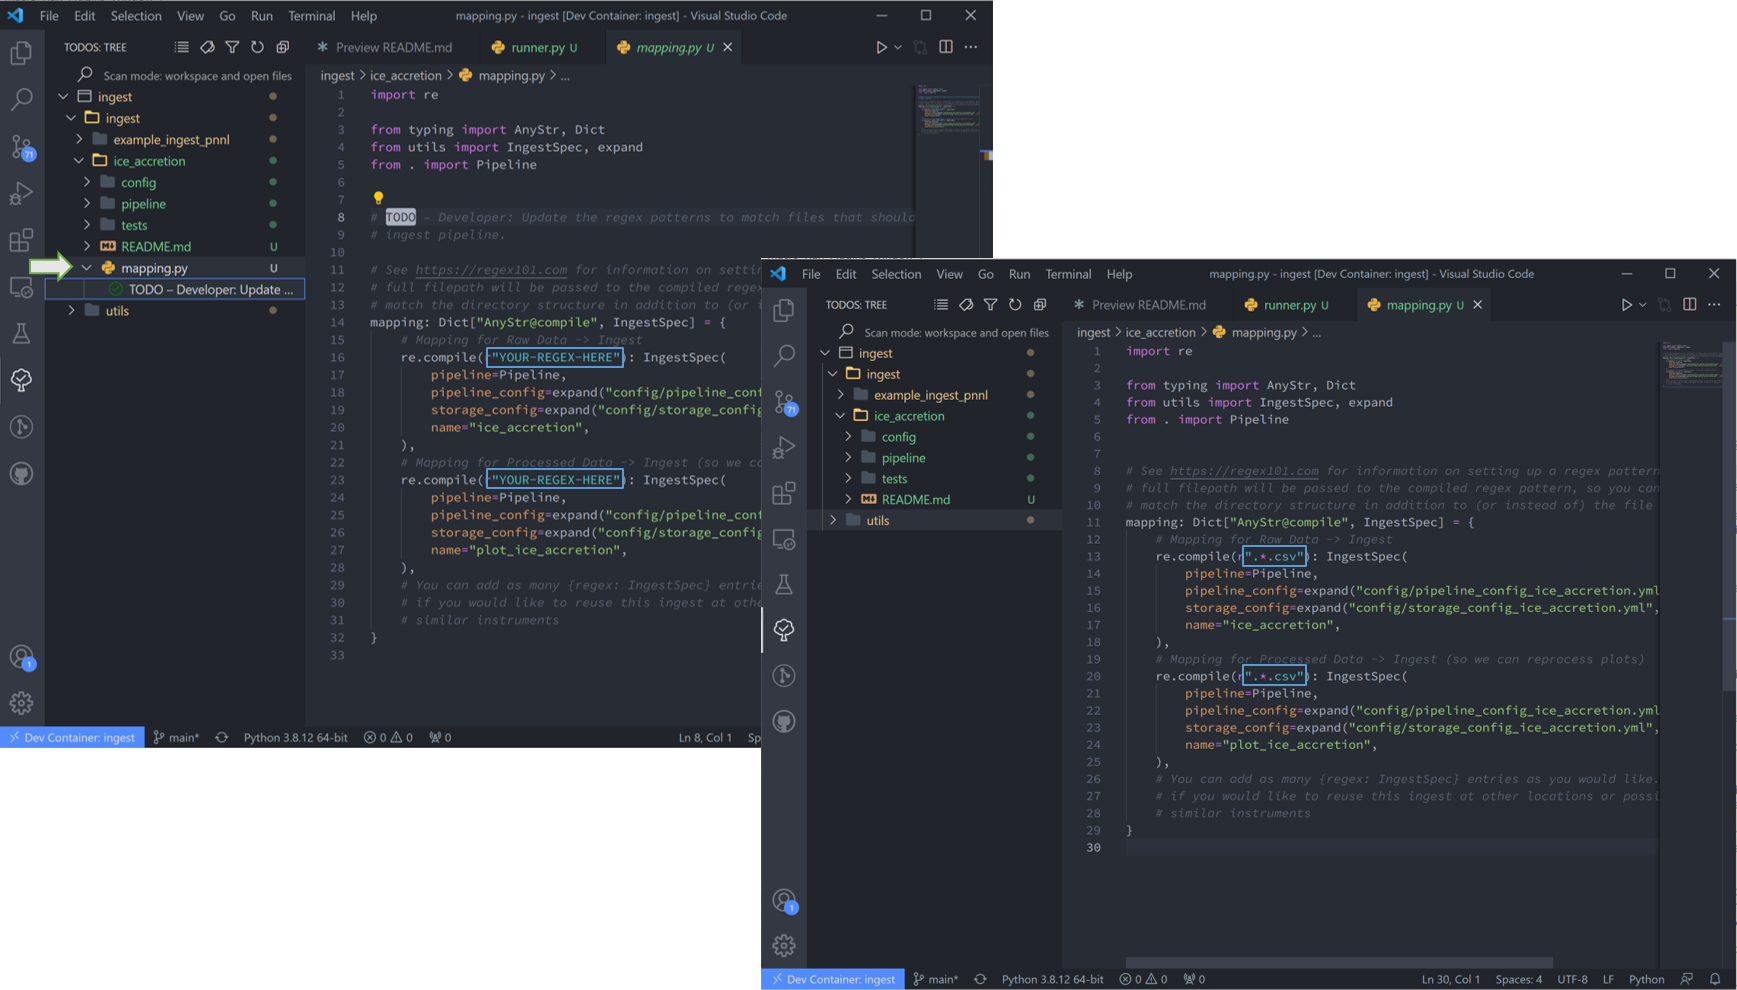
8. “mapping.py” is next. This particular file doesn’t have a repeatable pattern that Regex can accomodate, so we’ll simply use the file extension regex “.*.csv”.
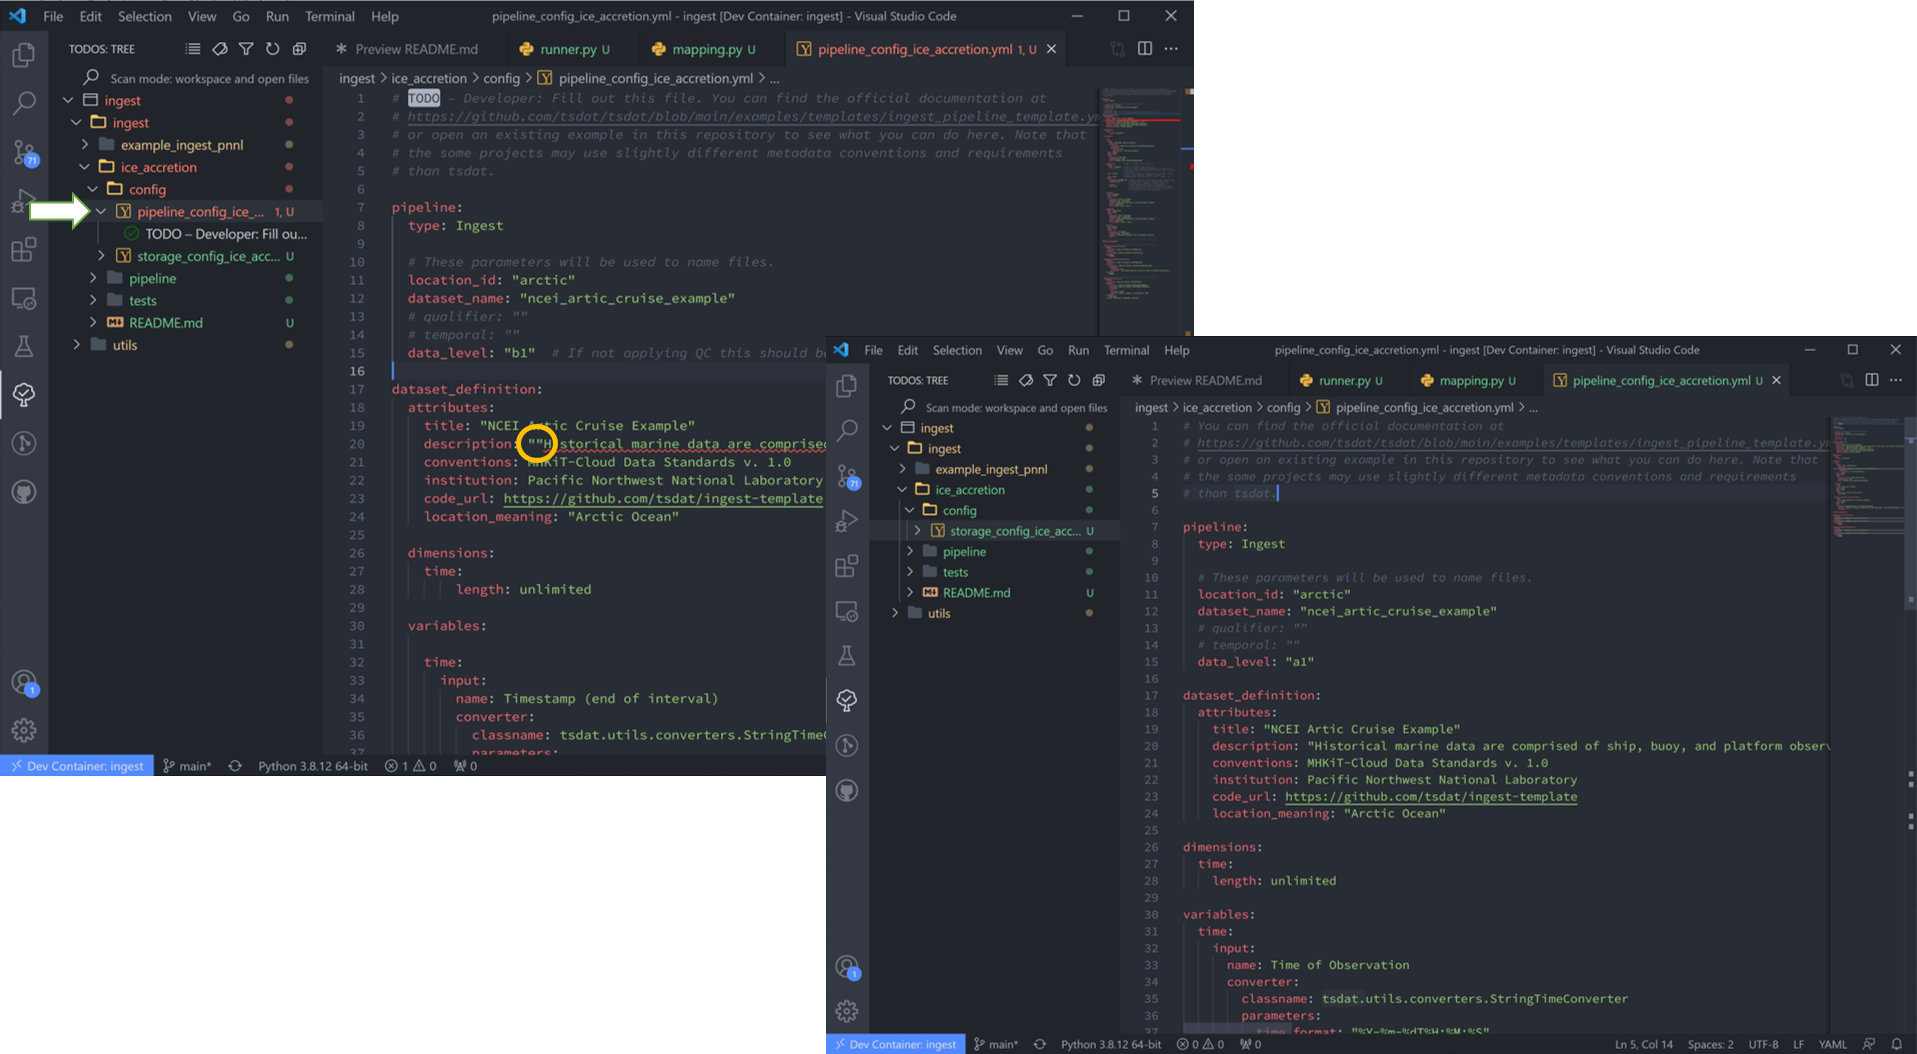
9. Now we will move on the configuration files. These are the most user-involved, and we’ll start with “pipeline_config_ice_accretion.yml”. which we’ll need to modify to capture the variables and metadata we want to retain in this ingest. My config file is shown below this next figure.
Note that if VS Code finds errors in a file, it highlights the file track in red. This particular case is due to double quotation marks, so I’ll get rid of the extra set of those in that line.
This part of the process can take some time, as it involves knowing or learning a lot of the context around the dataset and then writing it up succinctly and clearly so that your data users can quickly get a good understanding of what this dataset is and how to start using it. The pipeline config file is super specific to the particular dataset you are working on:
  1pipeline:
  2  type: Ingest
  3
  4  # These parameters will be used to name files.
  5  location_id: "arctic"
  6  dataset_name: "ncei_artic_cruise_example"
  7  # qualifier: ""
  8  # temporal: ""
  9  data_level: "a1"
 10
 11dataset_definition:
 12  attributes:
 13    title: "NCEI Artic Cruise Example"
 14    description: "Historical marine data are comprised of ship, buoy, and platform observations."
 15    conventions: MHKiT-Cloud Data Standards v. 1.0
 16    institution: Pacific Northwest National Laboratory
 17    code_url: https://github.com/tsdat/pipeline-template
 18    location_meaning: "Arctic Ocean"
 19
 20  dimensions:
 21    time:
 22      length: unlimited
 23
 24  variables:
 25    time:
 26      input:
 27        name: Time of Observation
 28        converter:
 29          classname: tsdat.utils.converters.StringTimeConverter
 30          parameters:
 31            time_format: "%Y-%m-%dT%H:%M:%S"
 32      dims: [time]
 33      type: long
 34      attrs:
 35        long_name: Time of Observation (UTC)
 36        standard_name: time
 37        units: seconds since 1970-01-01T00:00:00
 38
 39    lat:
 40      input:
 41        name: Latitude
 42      dims: [time]
 43      type: float
 44      attrs:
 45        long_name: Latitude
 46        units: degrees N
 47
 48    lon:
 49      input:
 50        name: Longitude
 51      dims: [time]
 52      type: float
 53      attrs:
 54        long_name: Longitude
 55        units: degrees E
 56
 57    ice_accretion:
 58      input:
 59        name: Ice Accretion On Ship
 60      dims: [time]
 61      type: int
 62      attrs:
 63        long_name: Ice Accretion On Ship
 64        comment: "1: Icing from ocean spray,
 65          2: Icing from fog,
 66          3: Icing from spray and fog,
 67          4: Icing from rain,
 68          5: Icing from spray and rain, "
 69        _FillValue: -1
 70
 71    ice_accretion_thickness:
 72      input:
 73        name: Thickness of Ice Accretion on Ship
 74      dims: [time]
 75      type: float
 76      attrs:
 77        long_name: Thickness of Ice Accretion on Ship
 78        units: "m"
 79
 80    ice_accretion_rate:
 81      input:
 82        name: Ice Accretion On Ship
 83      dims: [time]
 84      type: int
 85      attrs:
 86        long_name: Ice Accretion On Ship
 87        comment: "0: Ice not building up,
 88          1: Ice building up slowly,
 89          2: Ice building up rapidly,
 90          3: Ice melting or breaking up slowly,
 91          4: Ice melting or breaking up rapidly, "
 92        _FillValue: -1
 93
 94    pressure:
 95      input:
 96        name: Sea Level Pressure
 97      dims: [time]
 98      type: float
 99      attrs:
100        long_name: Pressure at Sea Level
101        units: hPa
102
103    pressure_tendency_characteristics:
104      input:
105        name: Characteristics of Pressure Tendency
106      dims: [time]
107      type: int
108      attrs:
109        long_name: Characteristics of Pressure Tendency
110        comment: "-1=Data is missing, 0=Increasing, then decreasing, 1=Increasing steadily or unsteadily, 2=Increasing steadily or unsteadily, 3=Decreasing or steady then increasing OR increasing then increasing more rapidly, 4=Steady. Pressure same as 3 hrs. ago, 5=Decreasing then increasing OR decreasing then decreasing more slowly, 6=Decreasing, then steady OR decreasing, then decreasing more slowly, 7=Decreasing steadily or unsteadily, 8=Steady or increasing then decreasing OR decreasing then decreasing more rapidly"
111        _FillValue: -1
112
113quality_management:
114  manage_missing_coordinates:
115    checker:
116      classname: tsdat.qc.checkers.CheckMissing
117    handlers:
118      - classname: tsdat.qc.handlers.FailPipeline
119    variables:
120      - COORDS
121
122  manage_coordinate_monotonicity:
123    checker:
124      classname: tsdat.qc.checkers.CheckMonotonic
125    handlers:
126      - classname: tsdat.qc.handlers.FailPipeline
127    variables:
128      - COORDS
129
130  manage_missing_data:
131    checker:
132      classname: tsdat.qc.checkers.CheckMissing
133    handlers:
134      - classname: tsdat.qc.handlers.RecordQualityResults
135        parameters:
136          bit: 1
137          assessment: Bad
138          meaning: "Missing datapoint"
139      - classname: tsdat.qc.handlers.RemoveFailedValues
140    variables:
141      - DATA_VARS
10. The file handler is managed in “storage_config_ice_accretion.yml”. For this particular dataset, we’ll use tsdat’s built-in filehandler.
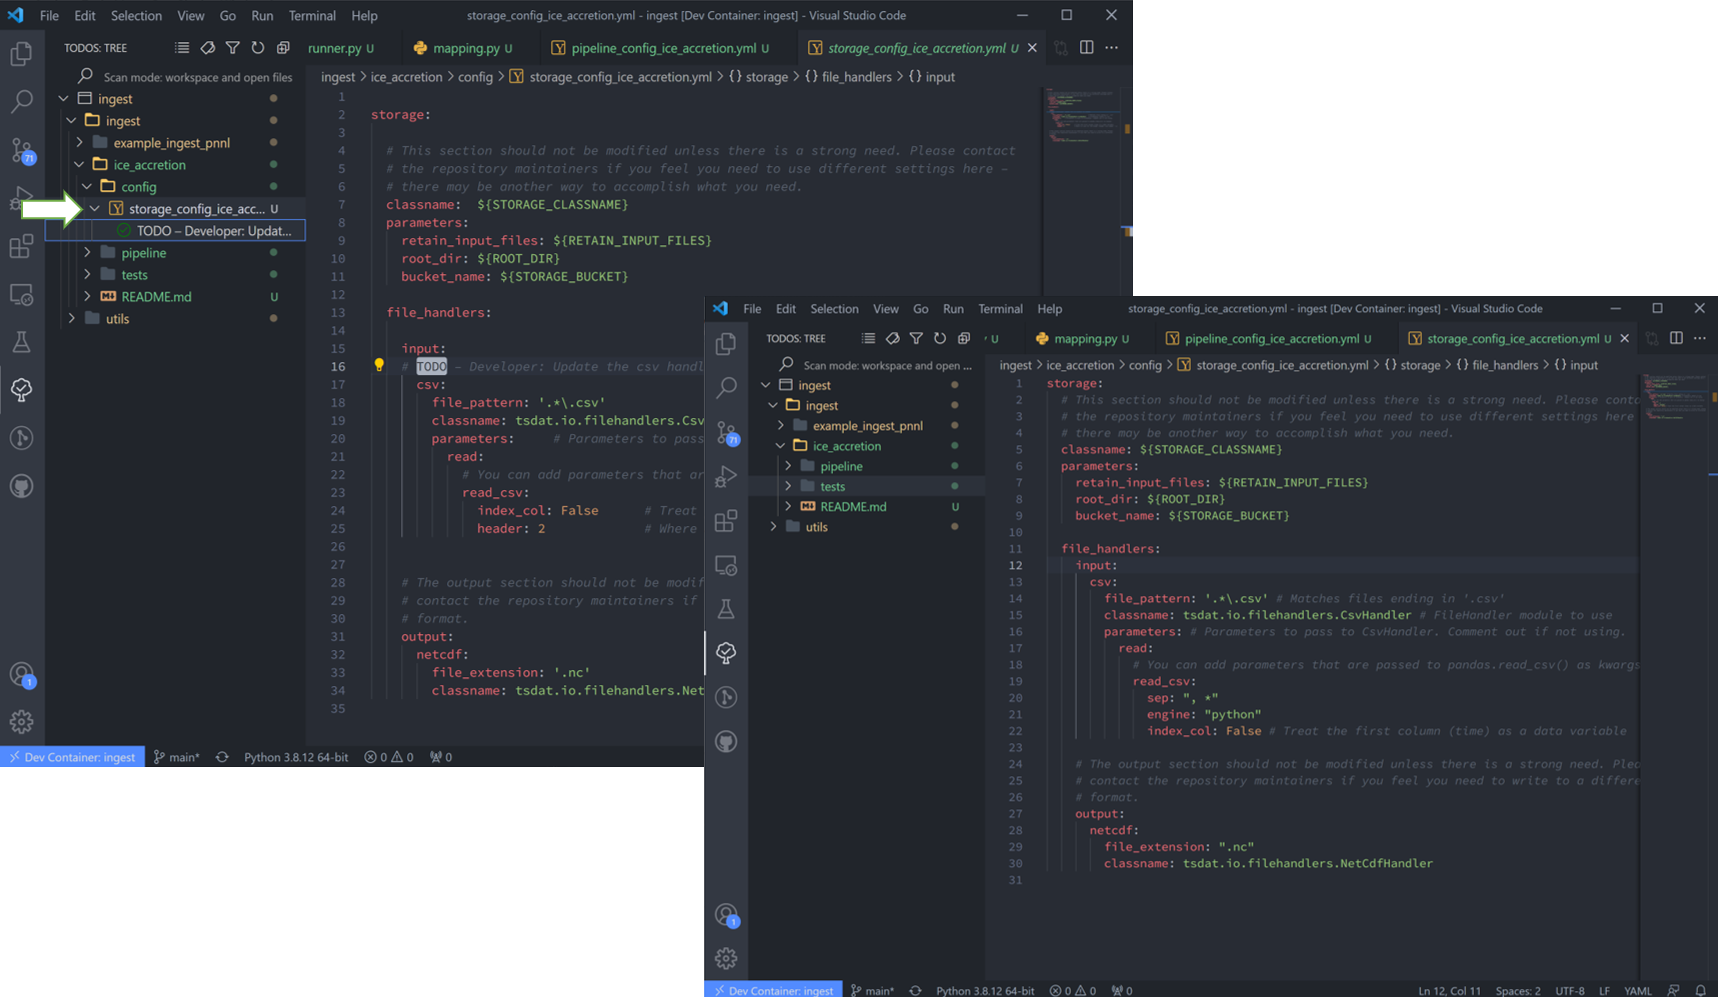
If we examine the sample csv closely we can see that a mixture of tabs, commas, and spaces are used to separate the columns. While this somewhat works visually, many libraries have trouble parsing this. To solve this with tsdat, we can add some parameters to the storage configuration file to indicate how those gaps should be handled. Put together, the storage config file for the data I want looks like this:
 1storage:
 2  classname: ${STORAGE_CLASSNAME}
 3  parameters:
 4  retain_input_files: ${RETAIN_INPUT_FILES}
 5  root_dir: ${ROOT_DIR}
 6  bucket_name: ${STORAGE_BUCKET}
 7
 8  file_handlers:
 9  input:
10    csv:
11    file_pattern: '.*\.csv' # Matches files ending in '.csv'
12    classname: tsdat.io.filehandlers.CsvHandler # FileHandler module to use
13    parameters: # Parameters to pass to CsvHandler. Comment out if not using.
14      read:
15        read_csv:
16          sep: ", *"
17          engine: "python"
18          index_col: False
19
20  output:
21    netcdf:
22    file_extension: ".nc"
23    classname: tsdat.io.filehandlers.NetCdfHandler
11. Finally “pipeline.py” is the last “get pipeline to working mode” “TODO” we should finish setting up here (excluding a custom file handler or QC functions, if needed. Those will get covered in another tutorial). It contains a series of “hook” functions that can be used along the pipeline for further data organization.
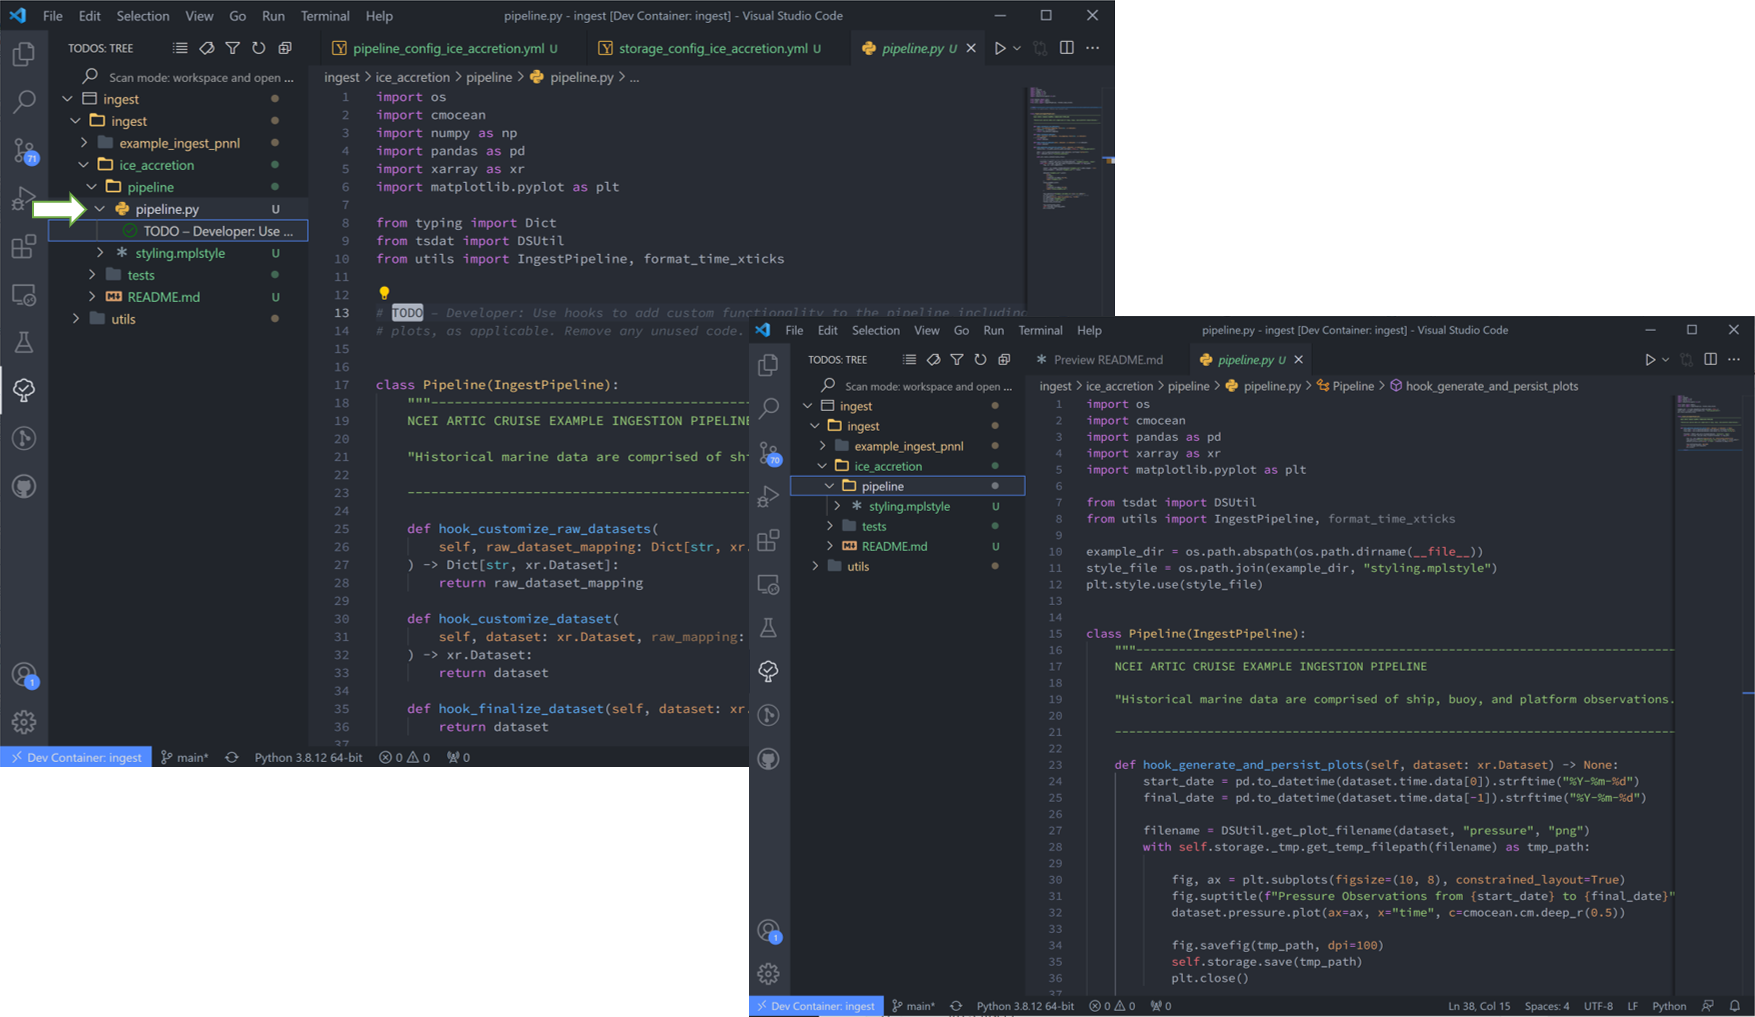
The most common used is the last one “hook_generate_and_persist_plots”, which plot the processed data and save them in the output folder. I’ve removed all others to keep this simple and created a simple plot for the pressure variable (Unforunately this particular dataset didn’t log ice accretion, so feel free to run more files from the NOAA database to see that data):
 1import os
 2import cmocean
 3import pandas as pd
 4import xarray as xr
 5import matplotlib.pyplot as plt
 6
 7from tsdat import DSUtil
 8from utils import IngestPipeline, format_time_xticks
 9
10example_dir = os.path.abspath(os.path.dirname(__file__))
11style_file = os.path.join(example_dir, "styling.mplstyle")
12plt.style.use(style_file)
13
14
15class Pipeline(IngestPipeline):
16    """--------------------------------------------------------------------------------
17    NCEI ARTIC CRUISE EXAMPLE INGESTION PIPELINE
18
19    "Historical marine data are comprised of ship, buoy, and platform observations."
20
21    --------------------------------------------------------------------------------"""
22    def hook_generate_and_persist_plots(self, dataset: xr.Dataset) -> None:
23        start_date = pd.to_datetime(dataset.time.data[0]).strftime("%Y-%m-%d")
24        final_date = pd.to_datetime(dataset.time.data[-1]).strftime("%Y-%m-%d")
25
26        filename = DSUtil.get_plot_filename(dataset, "pressure", "png")
27        with self.storage._tmp.get_temp_filepath(filename) as tmp_path:
28
29          fig, ax = plt.subplots(figsize=(10, 8), constrained_layout=True)
30          fig.suptitle(f"Pressure Observations from {start_date} to {final_date}")
31          dataset.pressure.plot(ax=ax, x="time", c=cmocean.cm.deep_r(0.5))
32
33          fig.savefig(tmp_path, dpi=100)
34          self.storage.save(tmp_path)
35          plt.close()
36
37        return
Running the Pipeline
We can now re-run the pipeline using the “runner.py” file as before:
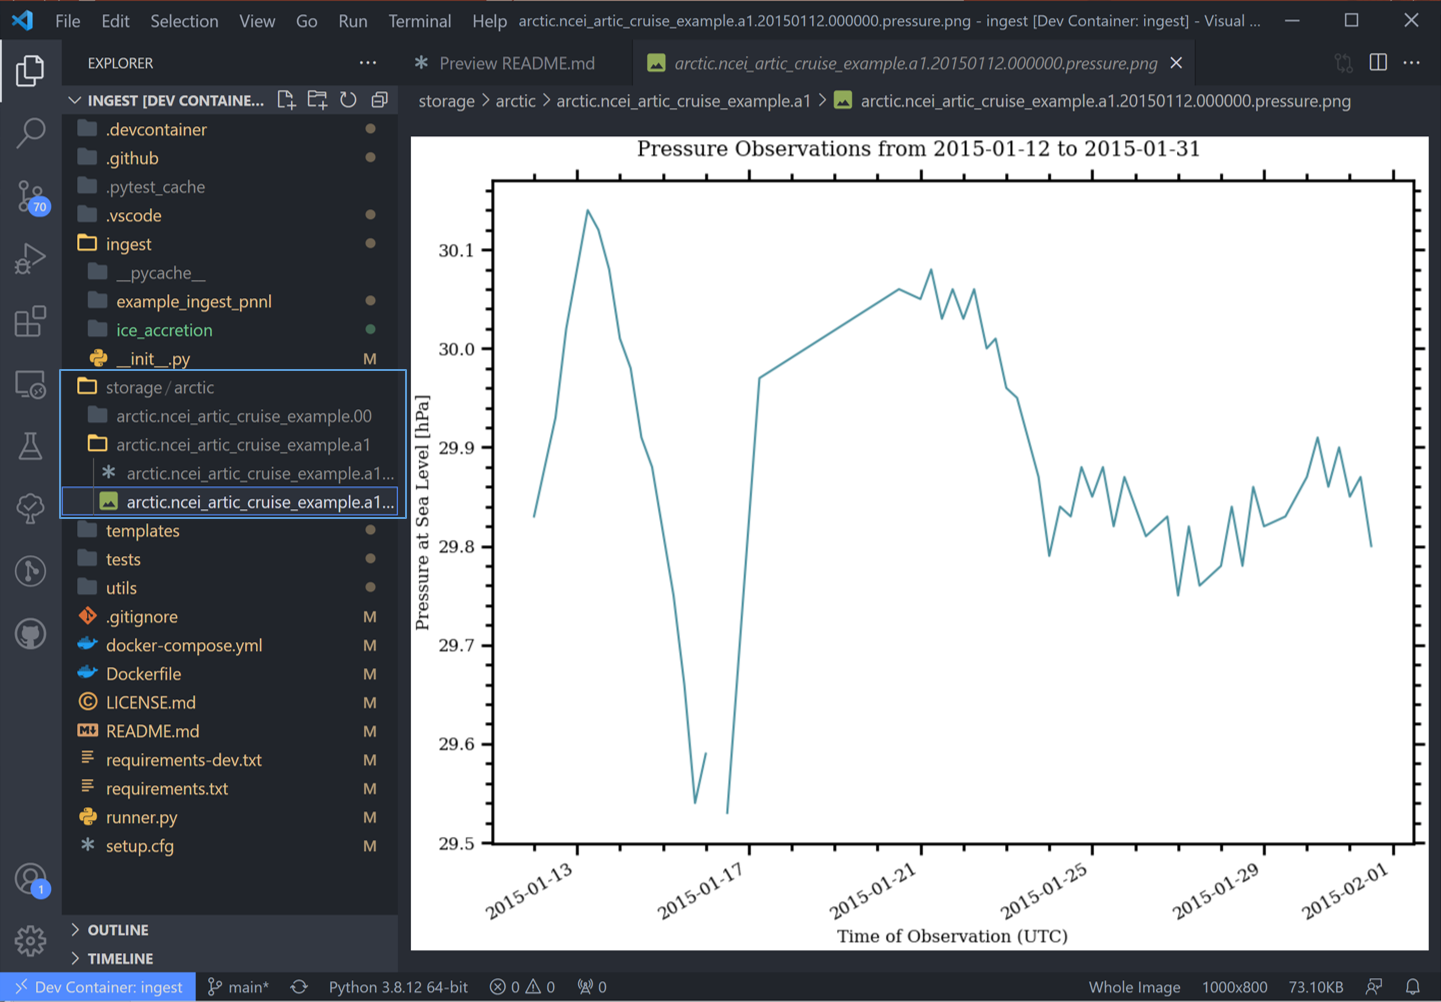
Once the pipeline runs, if you look in the “storage” folder, you’ll see the plot as well as the netCDF file output:
Data can be viewed by opening the terminal (ctrl `) and running a quick python shell:
# cd storage/arctic/arctic.ncei_artic_cruise_example.a1/
# python
In the python shell that opens, we can view the dataset for a quick overview:
>>> import xarray as xr
>>> ds = xr.open_dataset('arctic.ncei_artic_cruise_example.a1.20150112.000000.nc')
>>> ds
<xarray.Dataset>
Dimensions:                               (time: 55)
Coordinates:
  * time                                  (time) datetime64[ns] 2015-01-12 .....
Data variables: (12/14)
    lat                                   (time) float64 ...
    lon                                   (time) float64 ...
    ice_accretion                         (time) float64 ...
    ice_accretion_rate                    (time) float64 ...
    pressure                              (time) float64 ...
    pressure_tendency_characteristics     (time) float64 ...
    ...                                    ...
    qc_lon                                (time) int32 ...
    qc_ice_accretion                      (time) int32 ...
    qc_ice_accretion_rate                 (time) int32 ...
    qc_pressure                           (time) int32 ...
    qc_pressure_tendency_characteristics  (time) int32 ...
    qc_ice_accretion_thickness            (time) int32 ...
Attributes:
    title:             NCEI Artic Cruise Example
    description:       Historical marine data are comprised of ship, buoy, an...
    conventions:       MHKiT-Cloud Data Standards v. 1.0
    institution:       Pacific Northwest National Laboratory
    code_url:          https://github.com/tsdat/pipeline-template
    location_meaning:  Arctic Ocean
    datastream_name:   arctic.ncei_artic_cruise_example.a1
    input_files:       arctic.ncei_artic_cruise_example.00.20150112.000000.ra...
    history:           Ran at 2021-12-30 20:55:23
Pipeline Tests
The final TODOs listed are for adding detail to the pipeline description and for testing. Testing is best completed as a last step, after everything is set up and the pipeline outputs as expected. If running a large number of datafiles, a good idea is to input one of those datafiles here, along with its expected output, and have a separate data folder to collect input files.
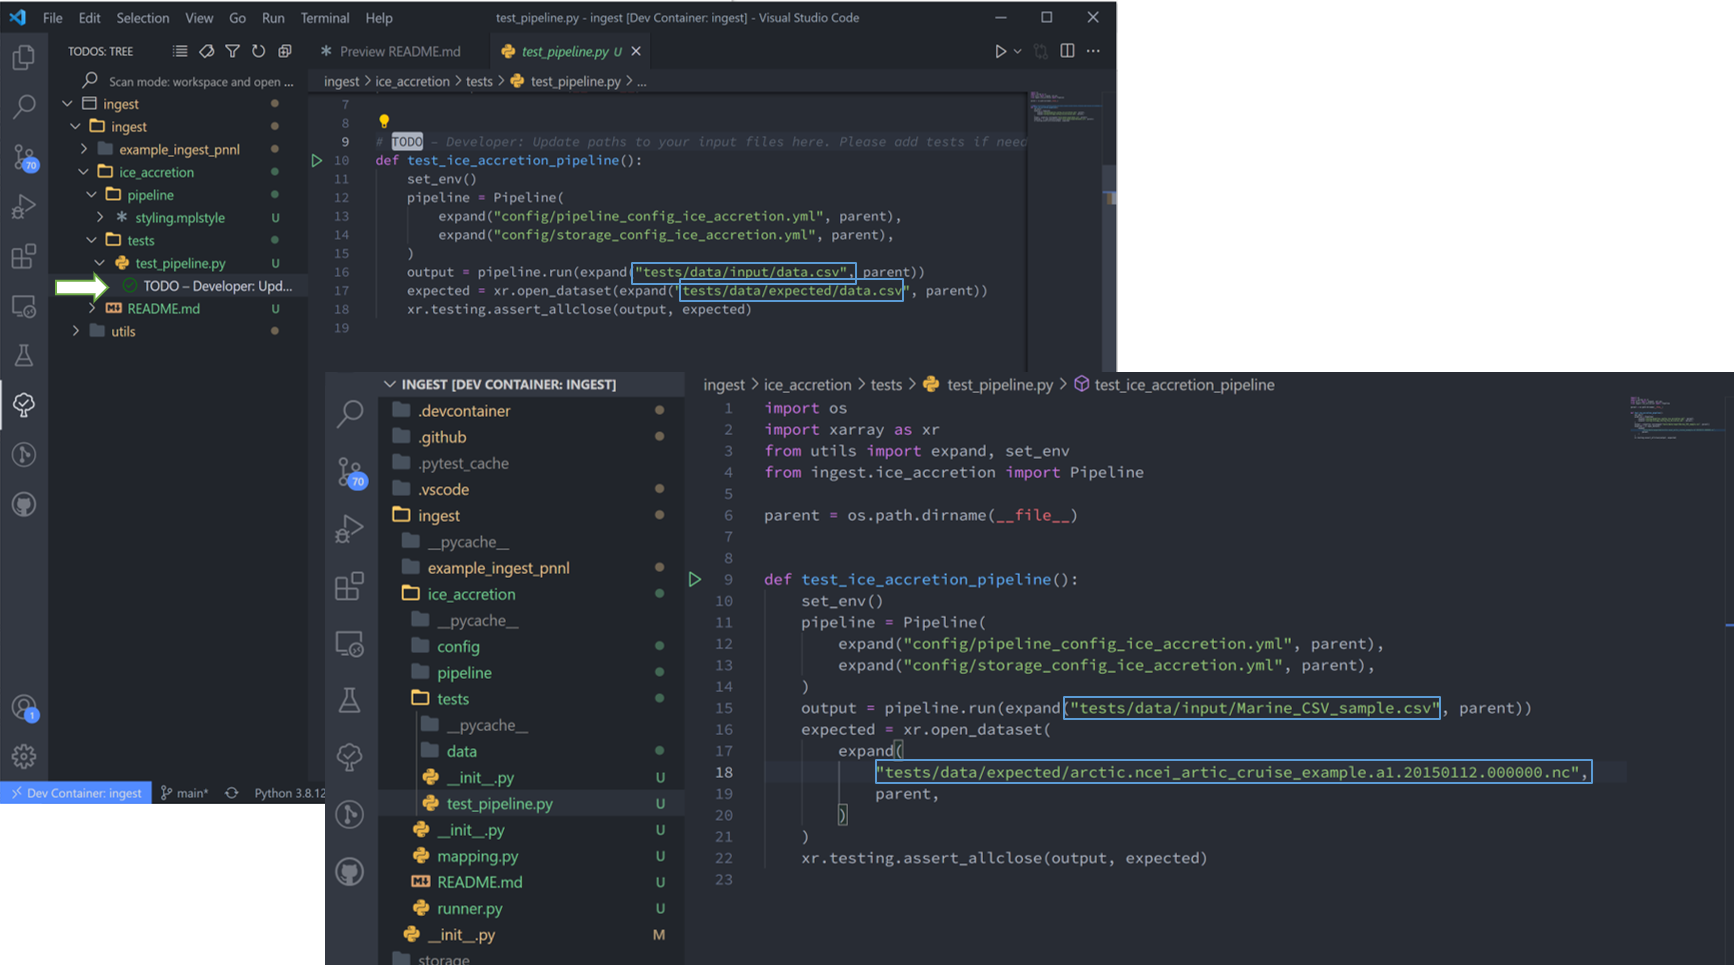
In the above figure I have moved the output netcdf file to the tests/data/expected/ folder for the test to work.